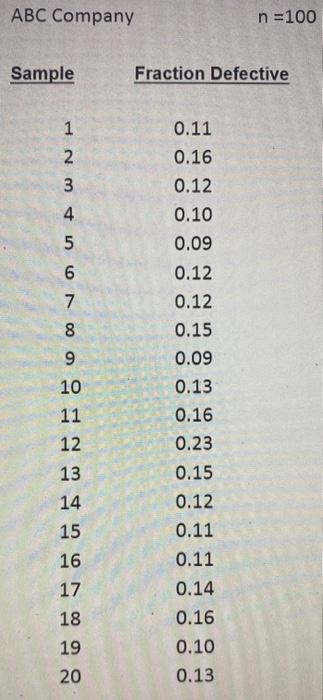
Question: 6-2. Using the data provided for ABC Data 1.xlsx_for a sample of 100 items, prepare a p-chart and explain whether the process is in statistical

6-2. Using the data provided for ABC Data
6-2. Using the data provided for ABC Data 1.xlsx_for a sample of 100 items, prepare a p-chart and explain whether the process is in statistical control. ABC Company n =100 Sample Fraction Defective 2 a Bovo AWNH 10 11 12 13 14 15 0.11 0.16 0.12 0.10 0.09 0.12 0.12 0.15 0.09 0.13 0.16 0.23 0.15 0.12 0.11 0.11 0.14 0.16 0.10 0.13 16 17 18 19 20

Step by Step Solution

There are 3 Steps involved in it

1 Expert Approved Answer
Step: 1 Unlock blur-text-image
Question Has Been Solved by an Expert!

Get step-by-step solutions from verified subject matter experts

Step: 2 Unlock
Step: 3 Unlock

Students Have Also Explored These Related General Management Questions!