Question: This assignment does not have a decision for you to make. You must perform an earned value analysis (EVA) of two project phases and assess
This assignment does not have a decision for you to make. You must perform an earned value analysis (EVA) of two project phases and assess their performance based on the EVA results. After completing the EVA, you will write an email to Victor Nguyen, NEIT Capital Managements Project Management Office Director, informing him of the your assessment.
These two documents have more information on how Earned Value Analysis is performed by NEIT Capital Management on the Cascada PREP project and provide some examples:
Download: Cascada PREP Earned Value Analysis Guidelines
Download: Earned Value Analysis Examples
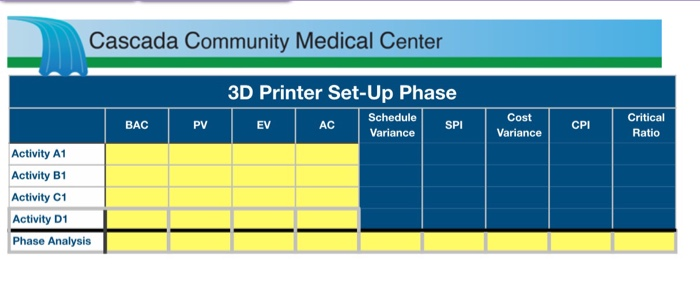
3D Printer Set-Up Phase EVA
The project has been progressing rapidly the last few weeks and very few issues have risen that were not already accounted for by your risk planning and mitigation. Despite some early challenges, the team responsible for installing, configuring and testing the 3D prosthetics printers has been working extra hard to ensure they complete their work on time so as not delay the rest of the project.
The 3D Printer team lead has approached you and asked if her team could have a company sponsored celebration in support of two team members who have gone above and beyond what was required to ensure the team stayed on track.
You decide to run a quick earned value analysis on the projects 3D Printer Set-Up Phase. There have been four key tasks under taken to date for this project phase. Below is the current status of each activity:
Activity A1 was to have cost $150,000 when complete. Its costs so far are $45,000. It is 35% complete. The activity has completed 5 weeks of a planned 15-week schedule.
Activity B1 is at the end of week 2 of a planned 4-week effort. It is 45% complete. It was to cost $100,000 when finished. Its costs to date are $50,000.
Activity C1 is finished. It finished 2 weeks late. It cost $100,000. And it was planned to have cost $110,000.
Activity D1 is ending its third week of a planned 6-week schedule. It has cost $200,000 so far. It was estimated to cost $450,000 when finished. It is approximately 55% complete.
Using the above data, calculate the following:
For each activity: PV, EV, and AC.
For this project phase: PV, EV, AC, SV, CV, SPI, CPI and critical ratio.
Assess this project phases performance to date. Has the teams performance warranted a celebration?
Include an explanation in your email to Victor.
Exterior Lot, Bridge and Landscaping Phase EVA
Because we are on a tight schedule, exterior lot work, such as landscaping and bridge construction, began as soon as the heavy equipment was removed from the work site. Though there were a few scheduling conflicts between various subcontractors when this phase began, the deputy project manager you hired to mitigate these issues has been on top of the issues.
A significant portion of the project budget and schedule are in this phase so you decide to perform an earned value analysis to assess the projects performance.
There have been four key tasks under taken to date for this project phase. Below is the current status of each activity:
Activity E2 was to have cost $250,000 when complete. Its costs so far are $165,000. It is 50% complete. The activity has completed 7 weeks of a planned 15-week schedule.
Activity F2 is at the end of week 2 of a planned 4-week effort. It is 65% complete. It was to cost $190,000 when finished. Its costs to date are $150,000.
Activity G2 is finished. It finished 2 weeks late. It cost $200,000 and it was planned to have cost $250,000.
Activity H2 is at the end of its fourth week of a planned 6-week schedule. It has cost $350,000 so far. It was estimated to cost $500,000 when finished. It is approximately 55% complete.
Using the above data, calculate the following:
For each activity: PV, EV, and AC.
For this project phase: PV, EV, AC, SV, CV, SPI, CPI and critical ratio.
What is your assessment of this project phase?
Include an explanation in your email to Victor.
How to Complete the Phase EVA Worksheet
Use this worksheet to help you perform an earned value analysis of the two phases:
Download: Phase EVA Worksheet
The worksheet has two tabs, one tab for each of the phases described above. Using the information for each activity, compute the BAC, PV, EV and AC for each of the activities. Then, total those values to find the BAC, PV, EV and AC for each the phase. Those values can then be used to compute the SV, CV, SPI, CPI and critical ratio for the phase.
You should only need to complete the yellow cells on each tab in the spreadsheet. All cells except for the Activity BACs and Activity ACs should use Excel formulas to compute values.
EVA Sample.png
cascada-deliverable-icon.pngWhat to Submit
Once you have completed the Phase EVA Worksheet, you should submit the following:
An email to Victor Nguyen, NEIT Capital Managements Project Management Office Director, informing him of the your assessment of each of the two phases of the project. You should explain your assessment by referencing the values in the EVA.
The completed Phase EVA Worksheet
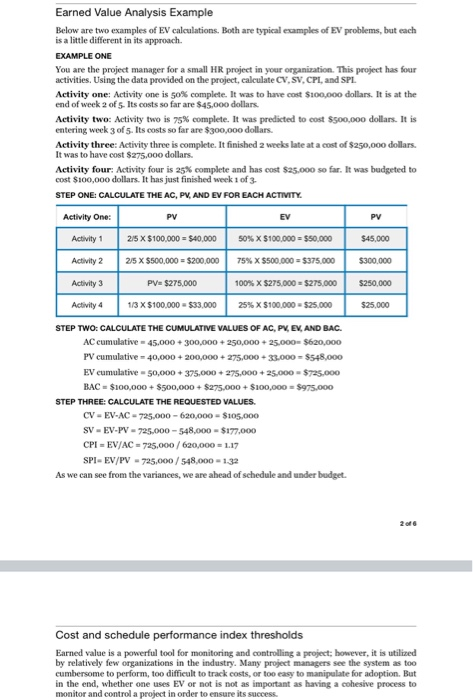
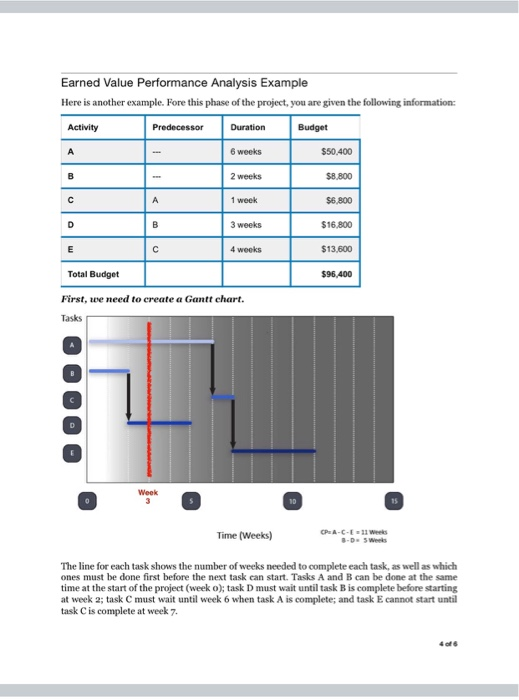
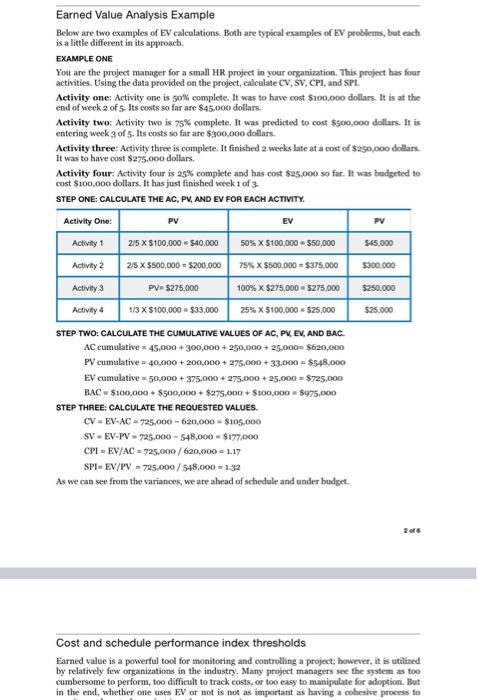
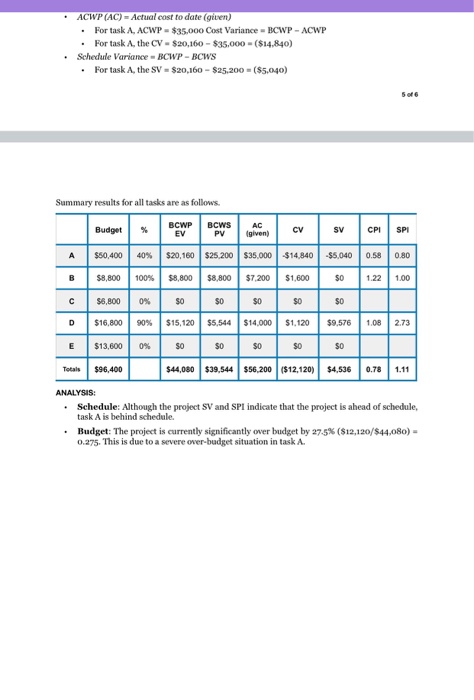
Cascada Community Medical Center 3D Printer Set-Up Phase EVAC Schedule Cost Variance SPI IV Variance BAC PV CPI Critical Ratio Activity A1 Activity B1 Activity C1 Activity D1 Phase Analysis Cascada Community Medical Center CASCADA COMMUNITY MEDICAL CENTER PROSTHETICS AND REHABILITATION EXPANSION PROJECT GUIDELINES FOR PROJECT REVIEWS AND EARNED VALUE ANALYSIS Project or Phase Performance Review Performance reviews are meetings that can be held periodically over a project to review performance of the project. The reports summarized in the chart below are typically used in conjunction with project performance reviews Metrics Used in Performance Reviews Variance analysis - Variance looks at actual performance compared to either planned performance or expected performance Costs and schedule are the factors most often calculated and or viewed. If variance is positive, the project is either head of schedule or under budget Negative variance signifies that the project is behind schedule or over budget. Earned value management (EVM)-Eamed value management compares the baseline plan to actual schedule and cost performance. Trend analysis - Trend analysis examines project performance over time to identify improvements and slips Project management software often contains functions that can complete several of these reports Controlling the cost of a project requires that the project management team constantly evaluate the actual values for cost against the expected values for cost. In Section 74. Control Costs, the PMBOK Guide explains more about the details of the earned value management technique and how it helps the project management team output work performance measurements fest variance, schedule variance, cost performance index, and schedule performance index values) and budget forecasts (calculated from historical data or bottom-up estimate at completion) necessary for monitoring or updating cost performance baselines Control Cost Basics: PV, EV, AC, SV, CV, SPI, and CPI At the heart of this technique is the comparison between planned value (PV), earned value (EV), and actual cost (AC), PV, EV, and AC values are used to assess whether work is being performed over time as planned Planned value (PV) - The authorized budget assigned to the scheduled work to be accomplished for a schedule activity or work break down structure component. It is also called the budgeted cost of work scheduled (BCWS) or the performance measurement baseline. While planned value in general is a continuous function that increases as the project neas completion, budget at completion (BAC) refers to the planned w ear the completion of the project. It is the target budget under which the project management team desire to finish the project Earned value (EV) The value of work performed essed in terms of the approved budget assigned to that work for a schedule activity or a work breakdown structure component. It is also called the budgeted cost of work performed (BCWP) Earned value (EV)- The value of work performed expressed in terms of the approved budget assigned to that work for a schedule activity or a work breakdown structure component. It is also called the budgeted cost of work performed (BWP Actual cost (AC) - The total cost actually incurred and recorded in accomplishing work performed during a given time period for a schedule activity of work breakdown structure component. Actual cost can sometimes be expressed in direct her house directo alone, or all costs including indirect costs. It is also called the actual cost of work performed (ACWP The planned value or performance measurement baseline takes into account cost, schedule and scope. Similar to the cost performance baseline, the planned is represented by a co s y rising line for every moment in the project's Bufe cycle, a cort o fe ty to meet objectives of scope at a certain amount of cost is planned for expected. One casymetric is the percentage completion of the project. The cared value up to the point of measurement divided by the planned value at completion will provide the project management team with the percent of the project that is complete. In addition, data about how much time and cost the project has used can be independently or jointly measured against the planned value up to the point of m oment These concepts can be confusing, but common sense will tell you that if a project management team has planned for a certain amount of work planned value) by the third work of a project, and the actual work (cared value) is more closely equivalent to the work that should have been completed by the second weck, the project is falling behind schedule. The formula for schedule variance tells you this as well: Measuring Schedule and Cost Variance Schedule variance - Earned value - Planned value Cost variance - Earned value-Actual cost Common sense will also tell you that if all of the work completed in the first phase of the project had a planned value of $10,000, and your cam completed the project for an actual cost of $9,000, your team is ahead of the game. The formula for cost variance will tell you the same These examples should also provide a framework for understanding a few additional, more complicated, points about these measures. When calculating CV or SV. you must use the same units for the items being compared. When calculating schedule variance, you might use percentage of the work packages complete or the time expected to complete the work packages. Even progress within individual work packages can be measured so long as adequate performance criteria were outlined in the WBS and WBS dictionary.) is also important to remember that carned value is calculated with respect to the performance measurement baseline (planned value) because it has already taken into account the requirements for scope, cost, and time. That means that EV cannot be higher than PV for an individual work package for opposed to the EV cat wwwlule which m alowe P repraw of schedule). This is because once a project meets the objectives for that component set by the planned value, no greater value can be added to it-it's 100% complete and nothing more. On the other hand, there is no limit on actual cost. Actual cost for a work package can be much higher than the camed cost although since average cannot generally be recouped by the project, actual cost will ideally be lower than cared value Performance Indices Cost performance index (CPI) -Earned value Actual cast Schedule performance index (SPI) -Earned value / Planned value Cost performance index (CPI) -Earned value Actual cost Schedule performance indes (SPI) -Earned value Planned value Calculating variances can be helpful when the project management team needs to understand how they are ahead or behind in color schedule, but if it wants to consider the impact of that Variance on the future or compare the variance between other projects, the SV and CV can be converted to a percent to create the schedule performance index (SPI) and cost performance index (CPI), respectively The most commonly used cost-efficiency indicator in project cost management is cost performance index (CPD), the ratio of card (El) created to actual co m pte d e the one of which is calcula . This wall you whether over the course of the period measured the project has been under over, or on the budget that was planned for the amount of camed value. ACH value less than 1. indicates a cestovams of the estimates, while a C reer than 10 indicates a cost deficit against the estimates. Cost performance index (CPT) - EVIAC The schedule performance index (SPI) is the ratio of cared value (Ev) created to pland value (PV) up the point of me . This value tell you whether over the course of the period measured the project has been under over, budget for the amount of cared value. An SP value less than 10 indicates the project is behind schedule, while an SP greater than 1. indicates that the project is ahead of schedule Schedule performance index (SPI) - EV/PV If you multiply SPI by CPI, you can assess the degree to which a project is going exactly as planned, an index measure known as critical ratie. If work is on schedule, ratios will be greater than 1.0; if work progress is slower than planned, ratios are less than 10. Critical ratio-SPICPI The SP and CPI are useful for forecasting future variance from the project's budget of completion (BAC). and forecasting techniques will be explained in the next section Cost Variance (CV)-EV- AC If work cost more than planned CV will be negative. If work cost less than planned CV will be positive. Schedule Variance (SV) FV-PV If the project took less time than planned, SV will be positive. If the project took more time than planned, SV will be negative. Cost performance index (CPI) - EVIAC If the project is over budget, CP will be less than 100% If the project is under budget. CPI will be greater than 100% Schedule performance index (SPI)-EV/PV If the project is behind schedule, SPI will be less than 100% Ir the project is ahead of schedule, SPI will be greater than 100% Forecasting As explained in the previous section budget at completion (BAC) refers to the planned value at the completion of the project. It is the target budget under which the project management team desires to finish the project. However, if the project management team recognizes that the project does not have the cured value that it should have for the money spent on the project, it might need to reevaluate and forecast a new more accurate estimate using the information it has gained about the project's performance over its life cycle. This new estimate is called the estimate at completion (EAC). The estimate completion (EAC) is used to determine the cost or amount of work needed to complete scheduled activities. The EAC may be calculated based on performance to date or it might be estimated camned value that it should have for the money spent on the project, it might need to evaluate and forecast a new more accurate estimate using the information has gained about the project's performance over its life cycle. This new estimate is called the estimate a completion (EAC) The estimate al completion (EAC) is used to determine the cost or amount of work needed to complete scheduled activities. The EAC may be calculated based on performance to date or it might be estimated bottom-up by the project team based on their own expertise based on the remaining work packages. Any forecasting done with cared value is not considered to be as manual forecasting of the remaining work by the project team, but manual forecasting can be time-consuming and can take cont away from meer takes Calculations generally add the actual cost of the project to date to an estimate to complete (ETC) the project, the estimate for completing the remaining work for a project, activity schedule or control account EAC-ACETC The ETC, and therefore the EAC can be calculated in various ways depending the optimum of the project management team. The PMBOK Guide provides three example formulas for use in different situations. In all the situation below, cared value has not met the planned value to the p o calculation, but in each s in different s pise made about the likelihood that the rema work packages will be completed on budget with respect to their planned values in each of these situations, EV, CP and SP refer to the cumulative EV, CP and SP of the completed work up the point of calculation . (ETC METHOD 1) If the variances are viewed as atypical and not expected in the future, and the project management team truly believes it can pick up the pace, managing for the completion of all we work packages such that the EV matches their PV, the ETC is calculated budget completion (BAC) minus the cumulative cared value to date (V)ETC -RACEV Therefore, EAC-AC + BAC - EV. (ETC METHOD 2) When variances are seen as typical, and the project management team expects that future work packages will be completed at the same rate they have been completed up to that time in the project, cared value to date is divided by the cumulative cost performance index (ETC BAC FV CPI). Therefore, EAC-BAC cumulative CPI (ETC METHOD 3) If the project management team understands that work has not been completed quickly enough to meet the requirements of an imposed schedule constraint, it can calculate the budget that will be required to increase the amount of resources to a level that will allow the work the completed in the remaining time: EAC-AC (BAC-EV)/(cumulative CPI x cumulative SPD When a project management team cannot change the budget at completion and it needs to calculate the performance necessary to finish the project on budget, it can calculate the to-complete performance Index. This index represents the level of performance for cost that is necessary to complete the project on budget, though whether this TCP is realistic or not depends on the situation, and the project management team may want to submit change requests to project schedule or scope if the budget is inflexible and the TCP is not feasible at the planned cost of the activities that need to be completed The to-complete performance Indies (TCP) is the calculated project of cost performance that must be achieved on the remaining work to meet a specified management poal sach as the budget completion (BAC) or the estimate completion (EAC). Essentially, it is the rate of remaining work to the funds remaining Again, EV refers to the cumulative EV of the completed work up to the point of calculation When using the BAC, TCPI (BAC-EV)/(BAC-AC) When using the EAC, TCPI-(BAC-EV)/(EAC-AC) Earned Value Basics Earned value is a system for relating planned budget and schedule to actual time and cost performance and is at the heart of the project control system. Responsibility for effective monitoring systems lies with the PM even though tasks may be delegated. In project management, there is a tendency to focus on doing rather than monitoring. Lots of activity is assumed to mean a lot is getting done. It is important to design effective monitoring systems at the planning stage and to maintain (and update) these systems as the project progresses. The importance of monitoring and controlling systems grows with the size and complexity of the project, but they are always required. One other term is needed in order to begin using EV: BAC. BAC, or budget at completion: This is the calculated value (during the planning of a project) of the cost of a given activity once the activity is complete. This may also be the projected cost of the entire project. In other words, how much did you expect this activity would cost when you originally planned the activity? Earned value revolves around three terms. PV, or planned value: This is the value of the work planned or scheduled at a given point in the project. It is calculated by the formula: PV =% of time expended X BAC EV, or earned value: This value represents the amount of value gained from the work completed so far. It is calculated by the following formula EV -% complete X BAC AC, or actual costs: This value represents the actual costs to date. Earned Value Formulas There are a number of EV formulas. We will be covering some of these in this week's lesson. The remainder will be covered next week. CV, or Cost VarianceEV- AC SV, or Schedule Variance = EV - PV CPI, or Cost Performance Index = EV / AC SPI, or Schedule Performance Index = EV / PV A positive cost variance, or a CPI greater than 1, indicates that the project is under budget. A negative cost variance, or a CPI less than 1, indicates that the project is over budget. ACV of or a CPI of indicates that the project is on target. A positive schedule variance, or an SPI greater than 1, indicates that the project is ahead of schedule. A negative schedule variance, or an SPI less than 1, indicates that the project is behind schedule. An SV of oor an SPI of 1 indicates that the project is on target. Earned Value Analysis Example Below are two examples of EV calculations. Both are typical examples of EV problems, but each Earned Value Analysis Example Below are two examples of EV calculations. Both are typical camples of problems, but each is a little different in its approach EXAMPLE ONE You are the project manager for a small HR project in your organization. This project has four activities. Using the data provided on the project, calculate CV, SV, CPI, and SPL Activity one: Activity one is 50% complete. It was to have cost $100.000 dollars. It is at the end of week 205. Its cost so far are $45.000 dollars Activity two: Activity two is 75% complete. It was predicted to cost $900.000 dollars. It is entering week 3 of 5. Its costs so far are $300,000 dollars. Activity three: Activity three is complete. It finished 2 weeks late at a cost of $250.000 dollars. It was to have cost $275.000 dollars. Activity four: Activity four is 25% complete and has cost $25.000 so far. It was budgeted to cost $100.000 dollars. It has just finished week 1 of 3 STEP ONE CALCULATE THE AC, PV, AND EV FOR EACH ACTIVITY Activity One: PV EV PV Activity 1 215 X $100.000 = $40.000 50% X $100.000 = 550.000 $45,000 Activity 2 $300.000 Activity 3 25 X $500,000 = $200,000 PV=$275.000 113 X $100,000 - $33,000 75% X 5500.000 = $375,000 100% X $275,000 - $275,000 25% X $100,000 - $25,000 $250.000 Activity 4 $25,000 STEP TWO: CALCULATE THE CUMULATIVE VALUES OF AC, PV, EV, AND BAC. AC cumulative = 45,000 + 300,000 + 250,000 + 25,000 $620,000 PV cumulative - 40,000 + 200,000 + 275,000 - 33,000 - $548,000 EV cumulative - 50,000+ 375.000 275,000 + 25,000 - $725,000 BAC = $100,000+ $500,000+ $275,000+ $100,000 = $975,000 STEP THREE: CALCULATE THE REQUESTED VALUES CV-EV-AC 725.000 - 620,000 - $105,000 SV-EV-PV - 725,000-548,000 - $177,000 CPIEV/AC 725.000 / 620,000 = 1.17 SPI-EV/PV-725.000 / 548,000 - 1.32 As we can see from the variances, we are ahead of schedule and under budget. Cost and schedule performance index thresholds Earned value is a powerful tool for monitoring and controlling a project; however, it is utilized by relatively few organizations in the industry. Many project managers see the system as too cumbersome to perform, too difficult to track costs, or too easy to manipulate for adoption. But in the end, whether one uses EV or not is not as important as having a cohesive process to monitor and control a project in order to ensure its success. Earned Value Performance Analysis Example Here is another example. For this phase of the project, you are given the following information: Activity Predecessor Duration Budget - 6 weeks $50.400 2 weeks $8.800 1 week $6.800 3 weeks $16.800 4 weeks $13,500 Total Budget $96,400 First, we need to create a Gantt chart. Tasks Time (Weeks) The line for each task shows the number of weeks needed to complete each task, as well as which ones must be done first before the next task can start. Tasks A and B can be done at the same time at the start of the project (week o): task D must wait until task B is complete before starting at week 2; task C must wait until week 6 when task A is complete; and task E cannot start until task C is complete at week 7. Earned Value Analysis Example Below are two examples of EV calculations. Both are typical examples of EV problems, but each is a little different in its approach EXAMPLE ONE You are the project manager for a small HR project in your organization. This project has four activities. Using the data provided on the project, calculate CV, SV, CPI, and SPL Activity one: Activity one is 50% complete. It was to have cost $100.000 dollars. It is at the end of week 2 of 5. Its costs so far are $45.000 dollars. Activity two: Activity two is 75% complete. It was predicted to cost $900,000 dollars. It is entering week 3 of 5. Its costs so far are $300,000 dollars. Activity three: Activity three is complete. It finished 2 weeks late at a cost of $250,000 dollars It was to have cost $275.000 dollars. Activity four: Activity four is 25% complete and has cost $25.000 so far. It was budgeted to cost $100.000 dollars. It has just finished weck 1 of 3 STEP ONE: CALCULATE THE AC, PV, AND EV FOR EACH ACTIVITY Activity One: PV EV Activity 1 215 x $100,000 - $40,000 545,000 50% X $100,000 - $50,000 75% X $500,000 - $375,000 Activity 2 $300.000 25 X $500,000 - $200.000 PV-$275,000 Activity 3 100% X $275,000 $275,000 $250,000 Activity 4 1/3 X $100,000 - $33,000 25% X $100,000 - $25,000 $25,000 STEP TWO: CALCULATE THE CUMULATIVE VALUES OF AC, PV, EV, AND BAC AC cumulative = 45.000 + 300,000 + 250,000 + 25.000= $620,000 PV cumulative = 40,000 + 200,000 + 275,000 + 33,000 = $548,000 EV cumulative = 50,000+ 375,000 + 275.000 + 25.000 = $725,000 BAC - $100,000+ $500,000 $275,000 $100,000 = $975.000 STEP THREE: CALCULATE THE REQUESTED VALUES CV-EV-AC - 725,000 - 620,000 - $105,000 SV - EV.PV - 725,000-548,000 $177,000 CPIEV/AC - 725.000 / 620,000 - 1.17 SPIEV/PV - 725,000 / 548,000 = 1.32 As we can see from the variances, we are ahead of schedule and under budget Cost and schedule performance index thresholds Earned value is a powerful tool for monitoring and controlling a project: however, it is utilized by relatively few organizations in the industry. Many project managers see the system as too cumbersome to perform, too difficult to track costs, or too easy to manipulate for adoption. But in the end, whether one uses EV or not is not as important as having a cohesive process to ACWP (AC) Actual cost to date (given) . For task A. ACWP - $35.000 Cost Variance - BCWP-ACWP For task A, the CV-$20,160 - $35.000 ($14.840) Schedule Variance - BCWP - BCWS For task A, the SV - $20,160 - $25.200 -($5.040) Summary results for all tasks are as follows. % BCWP BCws AC c sv CPI 0.58 0.80 1.221.00 Budget $50,400 $8,800 $6,800 $16,800 $13,600 $96,400 40% 100% 0% 90% 0% c $20,160 $25,200 $35,000 $8,800 $8,800 $7.200 $0 $0 $0 $15,120 $5,544 $14,000 $0 $0 $0 $44,080 $39,544 $56,200 $14,840 $1,600 $0 $1,120 -$5,040 $0 $0 $9,576 1.08 2.73 Totals $12,120) $4,536 0.78 1.11 ANALYSIS Schedule: Although the project SV and Spt indicate that the project is ahead of schedule, task A is behind schedule. Budget: The project is currently significantly over budget by 27.5% ($12,120/$44.080) 0.275. This is due to a severe over-budget situation in task A. Earned Value Basics Earned value is a system for relating planned budget and schedule to actual time and cost performance and is at the heart of the project control system. Responsibility for effective monitoring systems lies with the PM even though tasks may be delegated. In project management, there is a tendency to focus on doing rather than monitoring. Lots of activity is assumed to mean a lot is getting done. It is important to design effective monitoring systems at the planning stage and to maintain (and update) these systems as the project progresses. The importance of monitoring and controlling systems grows with the size and complexity of the project, but they are always required One other term is needed in order to begin using EV: BAC. BAC, or budget at completion: This is the calculated value (during the planning of a project) of the cost of a given activity once the activity is complete. This may also be the projected cost of the entire project. In other words, how much did you expect this activity would cost when you originally planned the activity? Earned value revolves around three terms. PV, or planned value: This is the value of the work planned or scheduled at a given point in the project. It is calculated by the formula: PV =% of time expended X BAC EV, or earned value: This value represents the amount of value gained from the work completed so far. It is calculated by the following formula EV -% complete X BAC AC, or actual costs: This value represents the actual costs to date. Earned Value Formulas There are a number of EV formulas. We will be covering some of these in this week's lesson. The remainder will be covered next week. CV, or Cost VarianceEV- AC SV, or Schedule Variance = EV - PV CPI, or Cost Performance Index = EV / AC SPI, or Schedule Performance Index = EV / PV A positive cost variance, or a CPI greater than 1, indicates that the project is under budget. A negative cost variance, or a CPI less than 1, indicates that the project is over budget. ACV of or a CPI of indicates that the project is on target. A positive schedule variance, or an SPI greater than 1, indicates that the project is ahead of schedule. A negative schedule variance, or an SPI less than 1, indicates that the project is behind schedule. An SV of oor an SPI of 1 indicates that the project is on target. Earned Value Analysis Example Below are two examples of EV calculations. Both are typical examples of EV problems, but each Cost and schedule performance index thresholds Earned value is a powerful tool for monitoring and controlling a project: however, it is utilized by relatively few organizations in the industry. Many project managers see the system as too cumbersome to perform, too difficult to track costs, or too easy to manipulate for adoption. But in the end, whether one uses EV or not is not as important as having a cohesive process to monitor and control a project in order to ensure its success. In the early stages of project planning, the team should determine thresholds for action based onto results of the earned value analysis. Here is an example for SPI and CPI: (Note: Less than 1 - poor performance; greater than 1 - good performance) 1.3 and up: Investigate immediately 1.2: Investigate at your leisure 0.9 to 1.2: Generally OK 0.9 to 0.8: Investigate 0.8 to 0.6: Prompt review and action required Less than 0.6: This project is in dire straits. Intervention by management may be needed to determine what actions should be taken regarding the future of this project Variances and indexes are plotted on control charts for trend analysis. Now let's look at the indexes in more detail. Normally, values of CPI/SPI between .90 and 1.20 are considered fine in a project. On the good side of the indexes (values above 1.0), values above 1.2 require investigation, because things that sound too good to be true usually are. Values above 1.3 should be investigated immediately, because they are much too good to be true. On the bad side of the indexes (values less than 1), values below.90 require investigation with the degree and urgency of the investigation increasing the lower of the CPI/SPI value. Values less than 0.8 require immediate investigation. Values less than 0.6 typically require serious intervention by the project manager and senior management to save a project. So in the project above, we need to investigate this project immediately, because its SPI is greater than 1.3. Cascada Community Medical Center 3D Printer Set-Up Phase EVAC Schedule Cost Variance SPI IV Variance BAC PV CPI Critical Ratio Activity A1 Activity B1 Activity C1 Activity D1 Phase Analysis Cascada Community Medical Center CASCADA COMMUNITY MEDICAL CENTER PROSTHETICS AND REHABILITATION EXPANSION PROJECT GUIDELINES FOR PROJECT REVIEWS AND EARNED VALUE ANALYSIS Project or Phase Performance Review Performance reviews are meetings that can be held periodically over a project to review performance of the project. The reports summarized in the chart below are typically used in conjunction with project performance reviews Metrics Used in Performance Reviews Variance analysis - Variance looks at actual performance compared to either planned performance or expected performance Costs and schedule are the factors most often calculated and or viewed. If variance is positive, the project is either head of schedule or under budget Negative variance signifies that the project is behind schedule or over budget. Earned value management (EVM)-Eamed value management compares the baseline plan to actual schedule and cost performance. Trend analysis - Trend analysis examines project performance over time to identify improvements and slips Project management software often contains functions that can complete several of these reports Controlling the cost of a project requires that the project management team constantly evaluate the actual values for cost against the expected values for cost. In Section 74. Control Costs, the PMBOK Guide explains more about the details of the earned value management technique and how it helps the project management team output work performance measurements fest variance, schedule variance, cost performance index, and schedule performance index values) and budget forecasts (calculated from historical data or bottom-up estimate at completion) necessary for monitoring or updating cost performance baselines Control Cost Basics: PV, EV, AC, SV, CV, SPI, and CPI At the heart of this technique is the comparison between planned value (PV), earned value (EV), and actual cost (AC), PV, EV, and AC values are used to assess whether work is being performed over time as planned Planned value (PV) - The authorized budget assigned to the scheduled work to be accomplished for a schedule activity or work break down structure component. It is also called the budgeted cost of work scheduled (BCWS) or the performance measurement baseline. While planned value in general is a continuous function that increases as the project neas completion, budget at completion (BAC) refers to the planned w ear the completion of the project. It is the target budget under which the project management team desire to finish the project Earned value (EV) The value of work performed essed in terms of the approved budget assigned to that work for a schedule activity or a work breakdown structure component. It is also called the budgeted cost of work performed (BCWP) Earned value (EV)- The value of work performed expressed in terms of the approved budget assigned to that work for a schedule activity or a work breakdown structure component. It is also called the budgeted cost of work performed (BWP Actual cost (AC) - The total cost actually incurred and recorded in accomplishing work performed during a given time period for a schedule activity of work breakdown structure component. Actual cost can sometimes be expressed in direct her house directo alone, or all costs including indirect costs. It is also called the actual cost of work performed (ACWP The planned value or performance measurement baseline takes into account cost, schedule and scope. Similar to the cost performance baseline, the planned is represented by a co s y rising line for every moment in the project's Bufe cycle, a cort o fe ty to meet objectives of scope at a certain amount of cost is planned for expected. One casymetric is the percentage completion of the project. The cared value up to the point of measurement divided by the planned value at completion will provide the project management team with the percent of the project that is complete. In addition, data about how much time and cost the project has used can be independently or jointly measured against the planned value up to the point of m oment These concepts can be confusing, but common sense will tell you that if a project management team has planned for a certain amount of work planned value) by the third work of a project, and the actual work (cared value) is more closely equivalent to the work that should have been completed by the second weck, the project is falling behind schedule. The formula for schedule variance tells you this as well: Measuring Schedule and Cost Variance Schedule variance - Earned value - Planned value Cost variance - Earned value-Actual cost Common sense will also tell you that if all of the work completed in the first phase of the project had a planned value of $10,000, and your cam completed the project for an actual cost of $9,000, your team is ahead of the game. The formula for cost variance will tell you the same These examples should also provide a framework for understanding a few additional, more complicated, points about these measures. When calculating CV or SV. you must use the same units for the items being compared. When calculating schedule variance, you might use percentage of the work packages complete or the time expected to complete the work packages. Even progress within individual work packages can be measured so long as adequate performance criteria were outlined in the WBS and WBS dictionary.) is also important to remember that carned value is calculated with respect to the performance measurement baseline (planned value) because it has already taken into account the requirements for scope, cost, and time. That means that EV cannot be higher than PV for an individual work package for opposed to the EV cat wwwlule which m alowe P repraw of schedule). This is because once a project meets the objectives for that component set by the planned value, no greater value can be added to it-it's 100% complete and nothing more. On the other hand, there is no limit on actual cost. Actual cost for a work package can be much higher than the camed cost although since average cannot generally be recouped by the project, actual cost will ideally be lower than cared value Performance Indices Cost performance index (CPI) -Earned value Actual cast Schedule performance index (SPI) -Earned value / Planned value Cost performance index (CPI) -Earned value Actual cost Schedule performance indes (SPI) -Earned value Planned value Calculating variances can be helpful when the project management team needs to understand how they are ahead or behind in color schedule, but if it wants to consider the impact of that Variance on the future or compare the variance between other projects, the SV and CV can be converted to a percent to create the schedule performance index (SPI) and cost performance index (CPI), respectively The most commonly used cost-efficiency indicator in project cost management is cost performance index (CPD), the ratio of card (El) created to actual co m pte d e the one of which is calcula . This wall you whether over the course of the period measured the project has been under over, or on the budget that was planned for the amount of camed value. ACH value less than 1. indicates a cestovams of the estimates, while a C reer than 10 indicates a cost deficit against the estimates. Cost performance index (CPT) - EVIAC The schedule performance index (SPI) is the ratio of cared value (Ev) created to pland value (PV) up the point of me . This value tell you whether over the course of the period measured the project has been under over, budget for the amount of cared value. An SP value less than 10 indicates the project is behind schedule, while an SP greater than 1. indicates that the project is ahead of schedule Schedule performance index (SPI) - EV/PV If you multiply SPI by CPI, you can assess the degree to which a project is going exactly as planned, an index measure known as critical ratie. If work is on schedule, ratios will be greater than 1.0; if work progress is slower than planned, ratios are less than 10. Critical ratio-SPICPI The SP and CPI are useful for forecasting future variance from the project's budget of completion (BAC). and forecasting techniques will be explained in the next section Cost Variance (CV)-EV- AC If work cost more than planned CV will be negative. If work cost less than planned CV will be positive. Schedule Variance (SV) FV-PV If the project took less time than planned, SV will be positive. If the project took more time than planned, SV will be negative. Cost performance index (CPI) - EVIAC If the project is over budget, CP will be less than 100% If the project is under budget. CPI will be greater than 100% Schedule performance index (SPI)-EV/PV If the project is behind schedule, SPI will be less than 100% Ir the project is ahead of schedule, SPI will be greater than 100% Forecasting As explained in the previous section budget at completion (BAC) refers to the planned value at the completion of the project. It is the target budget under which the project management team desires to finish the project. However, if the project management team recognizes that the project does not have the cured value that it should have for the money spent on the project, it might need to reevaluate and forecast a new more accurate estimate using the information it has gained about the project's performance over its life cycle. This new estimate is called the estimate at completion (EAC). The estimate completion (EAC) is used to determine the cost or amount of work needed to complete scheduled activities. The EAC may be calculated based on performance to date or it might be estimated camned value that it should have for the money spent on the project, it might need to evaluate and forecast a new more accurate estimate using the information has gained about the project's performance over its life cycle. This new estimate is called the estimate a completion (EAC) The estimate al completion (EAC) is used to determine the cost or amount of work needed to complete scheduled activities. The EAC may be calculated based on performance to date or it might be estimated bottom-up by the project team based on their own expertise based on the remaining work packages. Any forecasting done with cared value is not considered to be as manual forecasting of the remaining work by the project team, but manual forecasting can be time-consuming and can take cont away from meer takes Calculations generally add the actual cost of the project to date to an estimate to complete (ETC) the project, the estimate for completing the remaining work for a project, activity schedule or control account EAC-ACETC The ETC, and therefore the EAC can be calculated in various ways depending the optimum of the project management team. The PMBOK Guide provides three example formulas for use in different situations. In all the situation below, cared value has not met the planned value to the p o calculation, but in each s in different s pise made about the likelihood that the rema work packages will be completed on budget with respect to their planned values in each of these situations, EV, CP and SP refer to the cumulative EV, CP and SP of the completed work up the point of calculation . (ETC METHOD 1) If the variances are viewed as atypical and not expected in the future, and the project management team truly believes it can pick up the pace, managing for the completion of all we work packages such that the EV matches their PV, the ETC is calculated budget completion (BAC) minus the cumulative cared value to date (V)ETC -RACEV Therefore, EAC-AC + BAC - EV. (ETC METHOD 2) When variances are seen as typical, and the project management team expects that future work packages will be completed at the same rate they have been completed up to that time in the project, cared value to date is divided by the cumulative cost performance index (ETC BAC FV CPI). Therefore, EAC-BAC cumulative CPI (ETC METHOD 3) If the project management team understands that work has not been completed quickly enough to meet the requirements of an imposed schedule constraint, it can calculate the budget that will be required to increase the amount of resources to a level that will allow the work the completed in the remaining time: EAC-AC (BAC-EV)/(cumulative CPI x cumulative SPD When a project management team cannot change the budget at completion and it needs to calculate the performance necessary to finish the project on budget, it can calculate the to-complete performance Index. This index represents the level of performance for cost that is necessary to complete the project on budget, though whether this TCP is realistic or not depends on the situation, and the project management team may want to submit change requests to project schedule or scope if the budget is inflexible and the TCP is not feasible at the planned cost of the activities that need to be completed The to-complete performance Indies (TCP) is the calculated project of cost performance that must be achieved on the remaining work to meet a specified management poal sach as the budget completion (BAC) or the estimate completion (EAC). Essentially, it is the rate of remaining work to the funds remaining Again, EV refers to the cumulative EV of the completed work up to the point of calculation When using the BAC, TCPI (BAC-EV)/(BAC-AC) When using the EAC, TCPI-(BAC-EV)/(EAC-AC) Earned Value Basics Earned value is a system for relating planned budget and schedule to actual time and cost performance and is at the heart of the project control system. Responsibility for effective monitoring systems lies with the PM even though tasks may be delegated. In project management, there is a tendency to focus on doing rather than monitoring. Lots of activity is assumed to mean a lot is getting done. It is important to design effective monitoring systems at the planning stage and to maintain (and update) these systems as the project progresses. The importance of monitoring and controlling systems grows with the size and complexity of the project, but they are always required. One other term is needed in order to begin using EV: BAC. BAC, or budget at completion: This is the calculated value (during the planning of a project) of the cost of a given activity once the activity is complete. This may also be the projected cost of the entire project. In other words, how much did you expect this activity would cost when you originally planned the activity? Earned value revolves around three terms. PV, or planned value: This is the value of the work planned or scheduled at a given point in the project. It is calculated by the formula: PV =% of time expended X BAC EV, or earned value: This value represents the amount of value gained from the work completed so far. It is calculated by the following formula EV -% complete X BAC AC, or actual costs: This value represents the actual costs to date. Earned Value Formulas There are a number of EV formulas. We will be covering some of these in this week's lesson. The remainder will be covered next week. CV, or Cost VarianceEV- AC SV, or Schedule Variance = EV - PV CPI, or Cost Performance Index = EV / AC SPI, or Schedule Performance Index = EV / PV A positive cost variance, or a CPI greater than 1, indicates that the project is under budget. A negative cost variance, or a CPI less than 1, indicates that the project is over budget. ACV of or a CPI of indicates that the project is on target. A positive schedule variance, or an SPI greater than 1, indicates that the project is ahead of schedule. A negative schedule variance, or an SPI less than 1, indicates that the project is behind schedule. An SV of oor an SPI of 1 indicates that the project is on target. Earned Value Analysis Example Below are two examples of EV calculations. Both are typical examples of EV problems, but each Earned Value Analysis Example Below are two examples of EV calculations. Both are typical camples of problems, but each is a little different in its approach EXAMPLE ONE You are the project manager for a small HR project in your organization. This project has four activities. Using the data provided on the project, calculate CV, SV, CPI, and SPL Activity one: Activity one is 50% complete. It was to have cost $100.000 dollars. It is at the end of week 205. Its cost so far are $45.000 dollars Activity two: Activity two is 75% complete. It was predicted to cost $900.000 dollars. It is entering week 3 of 5. Its costs so far are $300,000 dollars. Activity three: Activity three is complete. It finished 2 weeks late at a cost of $250.000 dollars. It was to have cost $275.000 dollars. Activity four: Activity four is 25% complete and has cost $25.000 so far. It was budgeted to cost $100.000 dollars. It has just finished week 1 of 3 STEP ONE CALCULATE THE AC, PV, AND EV FOR EACH ACTIVITY Activity One: PV EV PV Activity 1 215 X $100.000 = $40.000 50% X $100.000 = 550.000 $45,000 Activity 2 $300.000 Activity 3 25 X $500,000 = $200,000 PV=$275.000 113 X $100,000 - $33,000 75% X 5500.000 = $375,000 100% X $275,000 - $275,000 25% X $100,000 - $25,000 $250.000 Activity 4 $25,000 STEP TWO: CALCULATE THE CUMULATIVE VALUES OF AC, PV, EV, AND BAC. AC cumulative = 45,000 + 300,000 + 250,000 + 25,000 $620,000 PV cumulative - 40,000 + 200,000 + 275,000 - 33,000 - $548,000 EV cumulative - 50,000+ 375.000 275,000 + 25,000 - $725,000 BAC = $100,000+ $500,000+ $275,000+ $100,000 = $975,000 STEP THREE: CALCULATE THE REQUESTED VALUES CV-EV-AC 725.000 - 620,000 - $105,000 SV-EV-PV - 725,000-548,000 - $177,000 CPIEV/AC 725.000 / 620,000 = 1.17 SPI-EV/PV-725.000 / 548,000 - 1.32 As we can see from the variances, we are ahead of schedule and under budget. Cost and schedule performance index thresholds Earned value is a powerful tool for monitoring and controlling a project; however, it is utilized by relatively few organizations in the industry. Many project managers see the system as too cumbersome to perform, too difficult to track costs, or too easy to manipulate for adoption. But in the end, whether one uses EV or not is not as important as having a cohesive process to monitor and control a project in order to ensure its success. Earned Value Performance Analysis Example Here is another example. For this phase of the project, you are given the following information: Activity Predecessor Duration Budget - 6 weeks $50.400 2 weeks $8.800 1 week $6.800 3 weeks $16.800 4 weeks $13,500 Total Budget $96,400 First, we need to create a Gantt chart. Tasks Time (Weeks) The line for each task shows the number of weeks needed to complete each task, as well as which ones must be done first before the next task can start. Tasks A and B can be done at the same time at the start of the project (week o): task D must wait until task B is complete before starting at week 2; task C must wait until week 6 when task A is complete; and task E cannot start until task C is complete at week 7. Earned Value Analysis Example Below are two examples of EV calculations. Both are typical examples of EV problems, but each is a little different in its approach EXAMPLE ONE You are the project manager for a small HR project in your organization. This project has four activities. Using the data provided on the project, calculate CV, SV, CPI, and SPL Activity one: Activity one is 50% complete. It was to have cost $100.000 dollars. It is at the end of week 2 of 5. Its costs so far are $45.000 dollars. Activity two: Activity two is 75% complete. It was predicted to cost $900,000 dollars. It is entering week 3 of 5. Its costs so far are $300,000 dollars. Activity three: Activity three is complete. It finished 2 weeks late at a cost of $250,000 dollars It was to have cost $275.000 dollars. Activity four: Activity four is 25% complete and has cost $25.000 so far. It was budgeted to cost $100.000 dollars. It has just finished weck 1 of 3 STEP ONE: CALCULATE THE AC, PV, AND EV FOR EACH ACTIVITY Activity One: PV EV Activity 1 215 x $100,000 - $40,000 545,000 50% X $100,000 - $50,000 75% X $500,000 - $375,000 Activity 2 $300.000 25 X $500,000 - $200.000 PV-$275,000 Activity 3 100% X $275,000 $275,000 $250,000 Activity 4 1/3 X $100,000 - $33,000 25% X $100,000 - $25,000 $25,000 STEP TWO: CALCULATE THE CUMULATIVE VALUES OF AC, PV, EV, AND BAC AC cumulative = 45.000 + 300,000 + 250,000 + 25.000= $620,000 PV cumulative = 40,000 + 200,000 + 275,000 + 33,000 = $548,000 EV cumulative = 50,000+ 375,000 + 275.000 + 25.000 = $725,000 BAC - $100,000+ $500,000 $275,000 $100,000 = $975.000 STEP THREE: CALCULATE THE REQUESTED VALUES CV-EV-AC - 725,000 - 620,000 - $105,000 SV - EV.PV - 725,000-548,000 $177,000 CPIEV/AC - 725.000 / 620,000 - 1.17 SPIEV/PV - 725,000 / 548,000 = 1.32 As we can see from the variances, we are ahead of schedule and under budget Cost and schedule performance index thresholds Earned value is a powerful tool for monitoring and controlling a project: however, it is utilized by relatively few organizations in the industry. Many project managers see the system as too cumbersome to perform, too difficult to track costs, or too easy to manipulate for adoption. But in the end, whether one uses EV or not is not as important as having a cohesive process to ACWP (AC) Actual cost to date (given) . For task A. ACWP - $35.000 Cost Variance - BCWP-ACWP For task A, the CV-$20,160 - $35.000 ($14.840) Schedule Variance - BCWP - BCWS For task A, the SV - $20,160 - $25.200 -($5.040) Summary results for all tasks are as follows. % BCWP BCws AC c sv CPI 0.58 0.80 1.221.00 Budget $50,400 $8,800 $6,800 $16,800 $13,600 $96,400 40% 100% 0% 90% 0% c $20,160 $25,200 $35,000 $8,800 $8,800 $7.200 $0 $0 $0 $15,120 $5,544 $14,000 $0 $0 $0 $44,080 $39,544 $56,200 $14,840 $1,600 $0 $1,120 -$5,040 $0 $0 $9,576 1.08 2.73 Totals $12,120) $4,536 0.78 1.11 ANALYSIS Schedule: Although the project SV and Spt indicate that the project is ahead of schedule, task A is behind schedule. Budget: The project is currently significantly over budget by 27.5% ($12,120/$44.080) 0.275. This is due to a severe over-budget situation in task A. Earned Value Basics Earned value is a system for relating planned budget and schedule to actual time and cost performance and is at the heart of the project control system. Responsibility for effective monitoring systems lies with the PM even though tasks may be delegated. In project management, there is a tendency to focus on doing rather than monitoring. Lots of activity is assumed to mean a lot is getting done. It is important to design effective monitoring systems at the planning stage and to maintain (and update) these systems as the project progresses. The importance of monitoring and controlling systems grows with the size and complexity of the project, but they are always required One other term is needed in order to begin using EV: BAC. BAC, or budget at completion: This is the calculated value (during the planning of a project) of the cost of a given activity once the activity is complete. This may also be the projected cost of the entire project. In other words, how much did you expect this activity would cost when you originally planned the activity? Earned value revolves around three terms. PV, or planned value: This is the value of the work planned or scheduled at a given point in the project. It is calculated by the formula: PV =% of time expended X BAC EV, or earned value: This value represents the amount of value gained from the work completed so far. It is calculated by the following formula EV -% complete X BAC AC, or actual costs: This value represents the actual costs to date. Earned Value Formulas There are a number of EV formulas. We will be covering some of these in this week's lesson. The remainder will be covered next week. CV, or Cost VarianceEV- AC SV, or Schedule Variance = EV - PV CPI, or Cost Performance Index = EV / AC SPI, or Schedule Performance Index = EV / PV A positive cost variance, or a CPI greater than 1, indicates that the project is under budget. A negative cost variance, or a CPI less than 1, indicates that the project is over budget. ACV of or a CPI of indicates that the project is on target. A positive schedule variance, or an SPI greater than 1, indicates that the project is ahead of schedule. A negative schedule variance, or an SPI less than 1, indicates that the project is behind schedule. An SV of oor an SPI of 1 indicates that the project is on target. Earned Value Analysis Example Below are two examples of EV calculations. Both are typical examples of EV problems, but each Cost and schedule performance index thresholds Earned value is a powerful tool for monitoring and controlling a project: however, it is utilized by relatively few organizations in the industry. Many project managers see the system as too cumbersome to perform, too difficult to track costs, or too easy to manipulate for adoption. But in the end, whether one uses EV or not is not as important as having a cohesive process to monitor and control a project in order to ensure its success. In the early stages of project planning, the team should determine thresholds for action based onto results of the earned value analysis. Here is an example for SPI and CPI: (Note: Less than 1 - poor performance; greater than 1 - good performance) 1.3 and up: Investigate immediately 1.2: Investigate at your leisure 0.9 to 1.2: Generally OK 0.9 to 0.8: Investigate 0.8 to 0.6: Prompt review and action required Less than 0.6: This project is in dire straits. Intervention by management may be needed to determine what actions should be taken regarding the future of this project Variances and indexes are plotted on control charts for trend analysis. Now let's look at the indexes in more detail. Normally, values of CPI/SPI between .90 and 1.20 are considered fine in a project. On the good side of the indexes (values above 1.0), values above 1.2 require investigation, because things that sound too good to be true usually are. Values above 1.3 should be investigated immediately, because they are much too good to be true. On the bad side of the indexes (values less than 1), values below.90 require investigation with the degree and urgency of the investigation increasing the lower of the CPI/SPI value. Values less than 0.8 require immediate investigation. Values less than 0.6 typically require serious intervention by the project manager and senior management to save a project. So in the project above, we need to investigate this project immediately, because its SPI is greater than 1.3