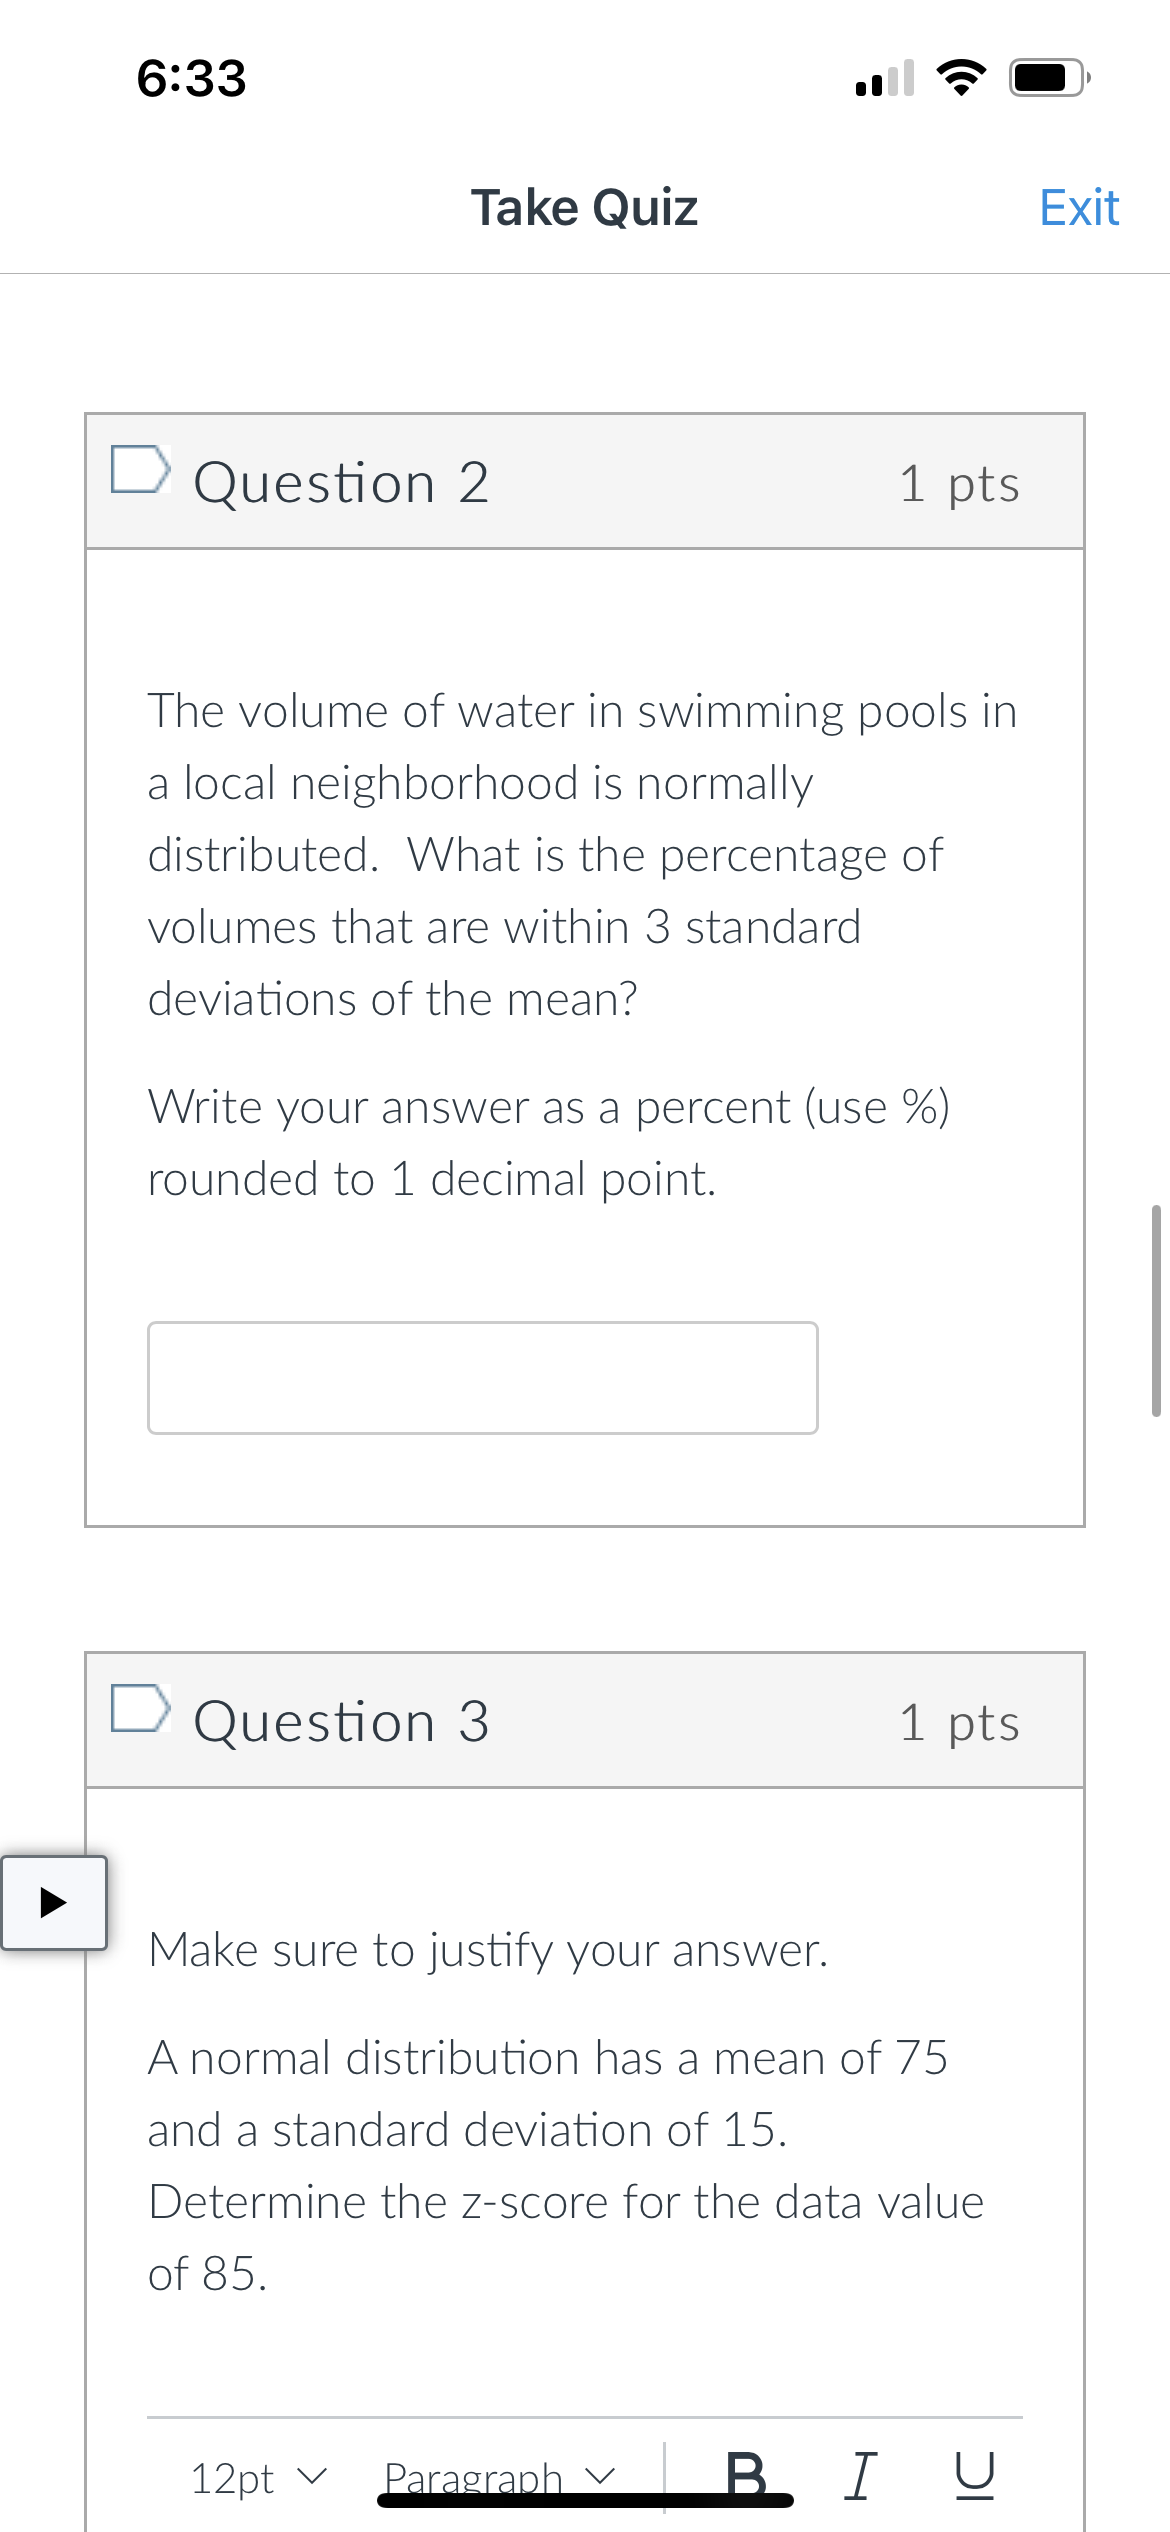
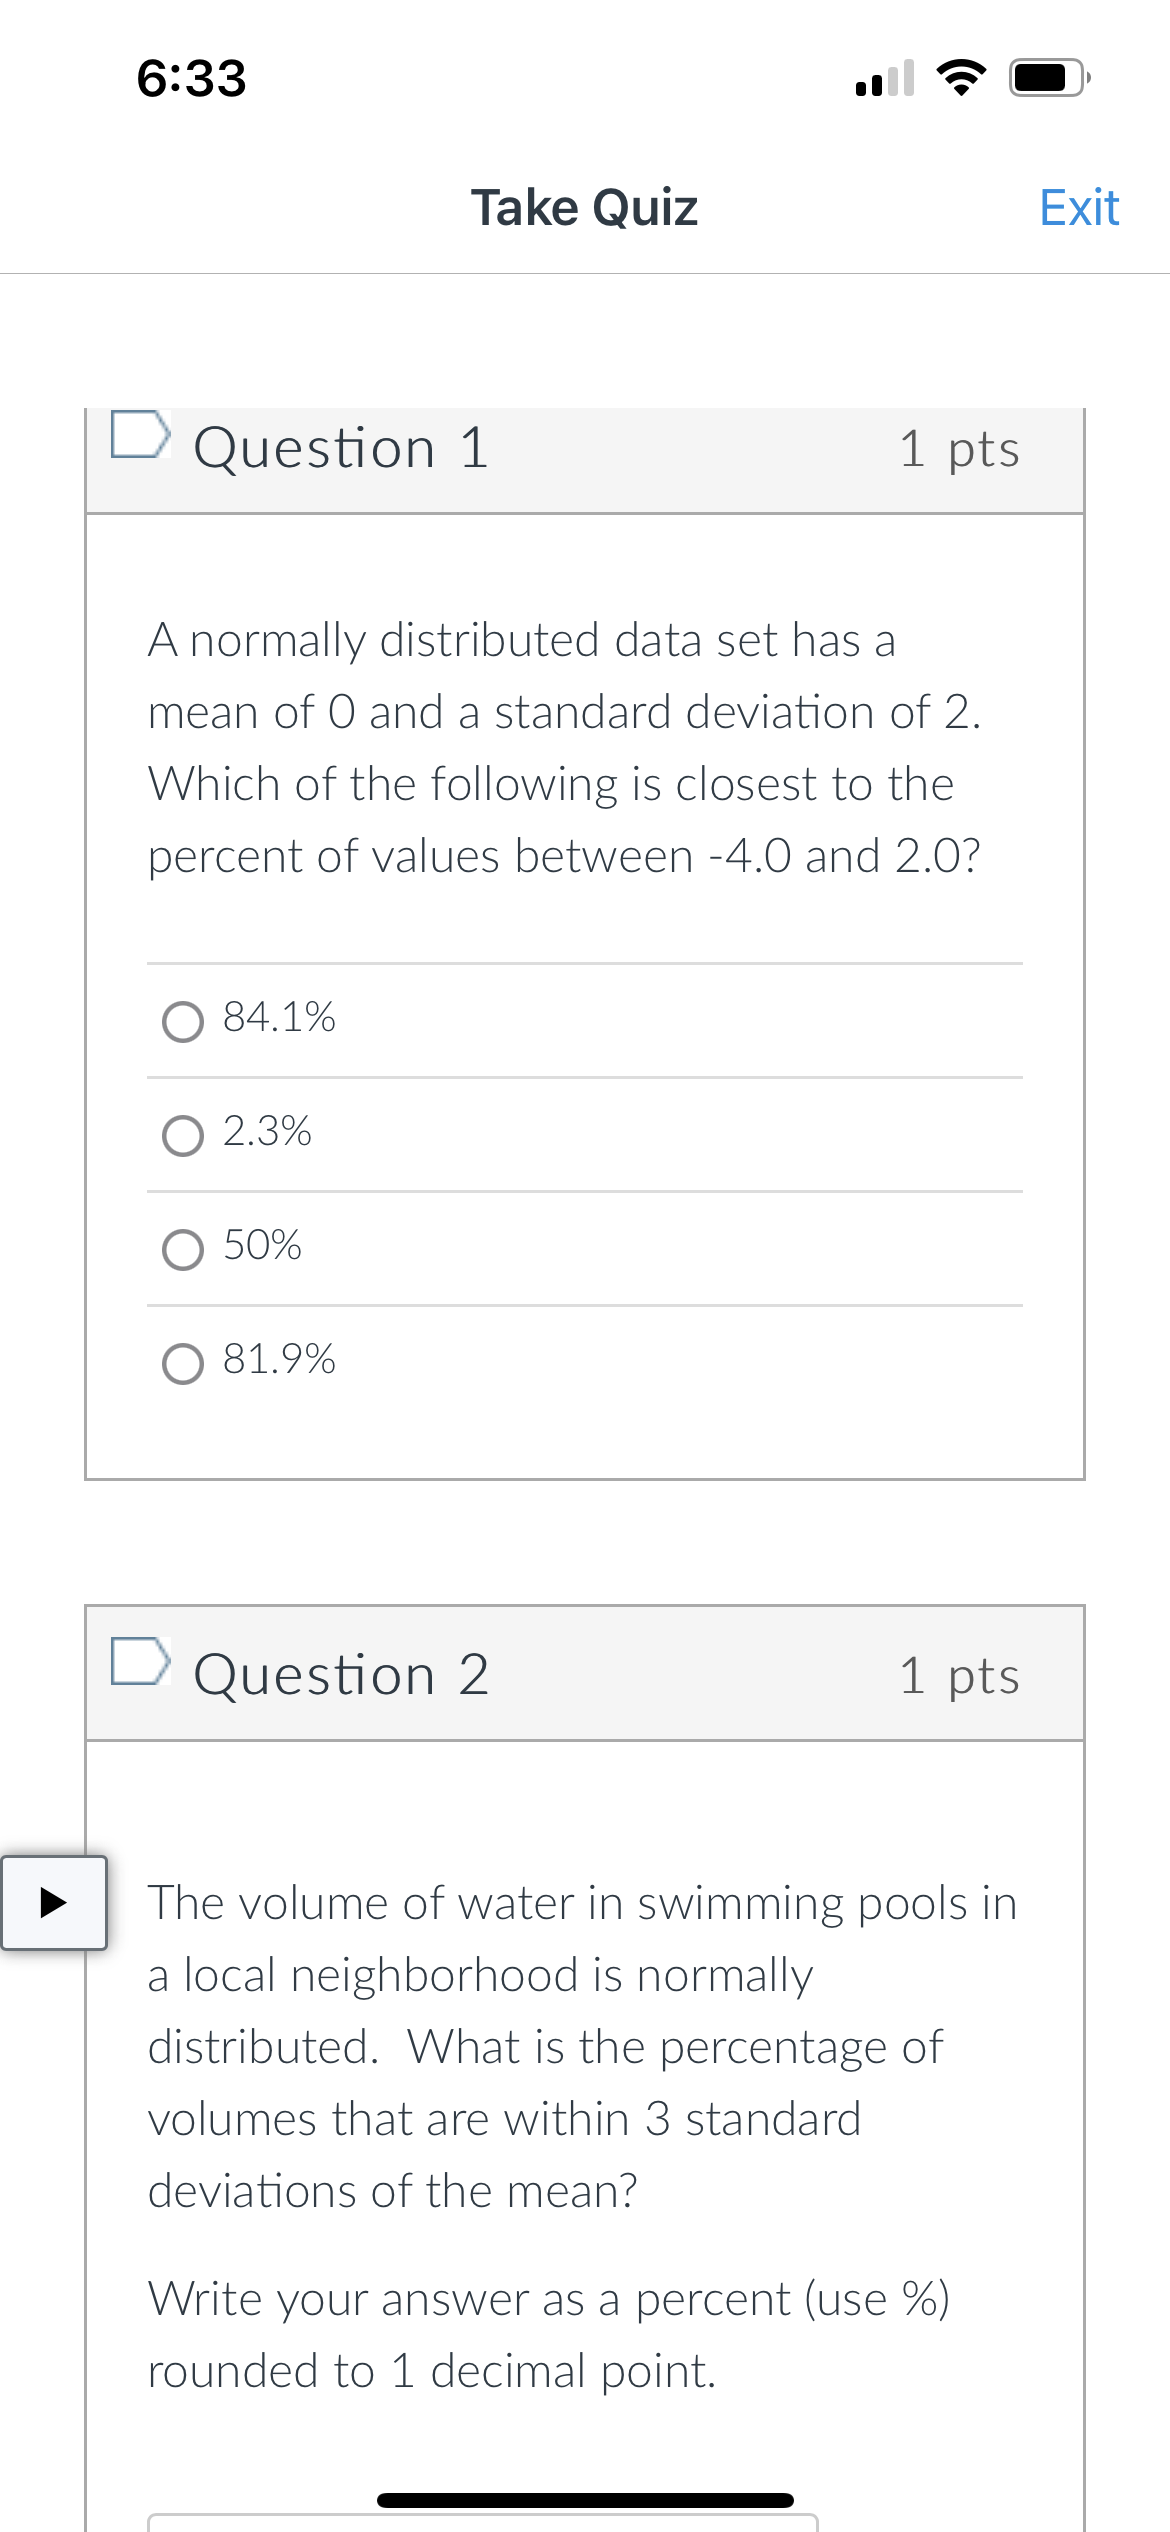
Question: 633 .Ill '3' C} Take Quiz Exit D Question 2 1 pts The volume of water in swimming pools in a local neighborhood is normally

633 .Ill '3' C} Take Quiz Exit D Question 2 1 pts633 .Ill '3' C} Take Quiz Exit D Question 2 1 pts633 .Ill '3' C} Take Quiz Exit D Question 2 1 pts633 .Ill '3' C} Take Quiz Exit D Question 2 1 pts633 .Ill '3' C} Take Quiz Exit D Question 2 1 pts633 .Ill '3' C} Take Quiz Exit D Question 2 1 pts
633 .Ill '3' C} Take Quiz Exit D Question 2 1 pts The volume of water in swimming pools in a local neighborhood is normally distributed. What is the percentage of volumes that are within 3 standard deviations of the mean? Write your answer as a percent (use %) rounded to 1 decimal point. D Question 3 1 pts Make sure to justify your answer. A normal distribution has a mean of 75 and a standard deviation of 15. Determine the Zscore for the data value of 85. 6:33 II 6:? @' Take Quiz Exit You can insert Desmos graphs or hand drawn graphs. Draw a normal curve representation for the area, then write the numerical value of the area under the normal curve for each of the following. A) All values below the mean B) All values to the left of Z=2.17 IC 12pt V Paragraph V B I 6:33 S Take Quiz Exit Question 3 1 pts Make sure to justify your answer. A normal distribution has a mean of 75 and a standard deviation of 15. Determine the z-score for the data value of 85. 12pt V Paragraph B I U 0 words w /6:34 .I "5' [E' Take Quiz Exit You can insert Desmos graphs or hand drawn graphs. Draw a normal curve representation for the area, then write the numerical value of the area under the normal curve for each of the following. A) All values to the right of 2:286 B) All values Not between 1.09 and 0.16 standard deviations from the mean. (hint: if you use Desmos, you will need to create two graphs) 12pt V Paragraph V B I Q 6:34 S Take Quiz Exit You can insert a Desmos graph or a hand- drawn graph. A set of data has a normal distribution with a mean of 50 and a standard deviation of 10. Draw a normal distribution to model these data and find the percent of data within each interval. A. All values between 50 to 60. B. All values less than 30. C. All values NOT between 40 and 50 12pt V Paragraph BI U6:33 .I '5' C} Take Quiz Exit D Question 1 1 pts A normally distributed data set has a mean of O and a standard deviation of 2. Which of the following is closest to the percent of values between 4.0 and 2.0? O 84.1% 0 2.3% o 50% O 81.9% D Question 2 1 pts u The volume of water in swimming pools in a local neighborhood is normally distributed. What is the percentage of volumes that are within 3 standard deviations of the mean? Write your answer as a percent (use %) rounded to 1 decimal point

Step by Step Solution

There are 3 Steps involved in it

1 Expert Approved Answer
Step: 1 Unlock blur-text-image
Question Has Been Solved by an Expert!

Get step-by-step solutions from verified subject matter experts

Step: 2 Unlock
Step: 3 Unlock

Students Have Also Explored These Related Mathematics Questions!