

Question: 65 and 90. 25. Table 1.8 shows a data set containing information for 25 of the shadow stocks tracked by the American Association of Individual
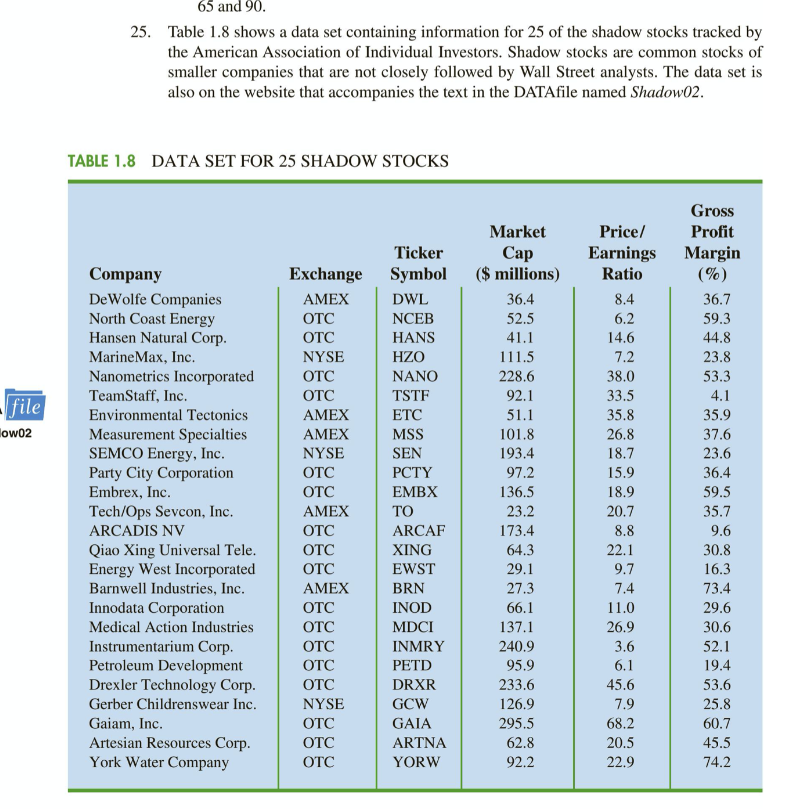
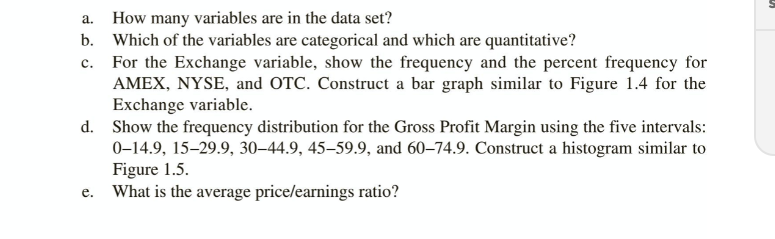
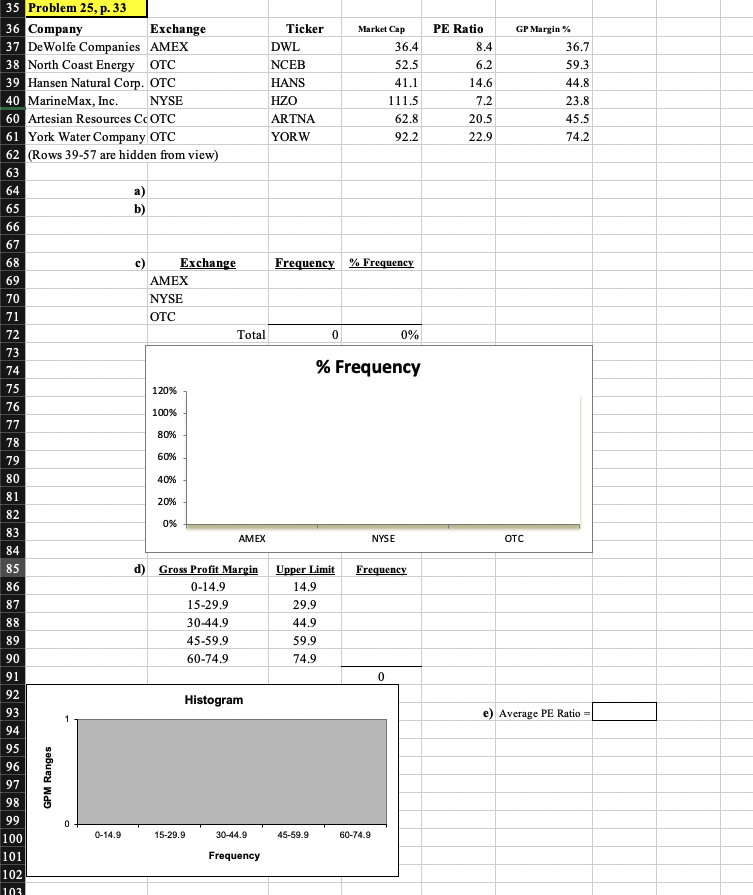
65 and 90. 25. Table 1.8 shows a data set containing information for 25 of the shadow stocks tracked by the American Association of Individual Investors. Shadow stocks are common stocks of smaller companies that are not closely followed by Wall Street analysts. The data set is also on the website that accompanies the text in the DATAfile named Shadow02. TABLE 1.8 DATA SET FOR 25 SHADOW STOCKS file owo2 Company De Wolfe Companies North Coast Energy Hansen Natural Corp. Marine Max, Inc. Nanometrics Incorporated TeamStaff, Inc. Environmental Tectonics Measurement Specialties SEMCO Energy, Inc. Party City Corporation Embrex, Inc. Tech/Ops Sevcon, Inc. ARCADIS NV Qiao Xing Universal Tele. Energy West Incorporated Barnwell Industries, Inc. Innodata Corporation Medical Action Industries Instrumentarium Corp. Petroleum Development Drexler Technology Corp. Gerber Childrenswear Inc. Gaiam, Inc. Artesian Resources Corp. York Water Company Exchange AMEX OTC OTC NYSE OTC OTC AMEX AMEX NYSE OTC OTC AMEX OTC OTC OTC AMEX OTC OTC OTC OTC OTC NYSE Ticker Symbol DWL NCEB HANS HZO NANO TSTF ETC MSS SEN PCTY EMBX TO ARCAF XING EWST BRN INOD MDCI INMRY PETD DRXR GCW GAIA ARTNA YORW Market Cap ($ millions) 36.4 52.5 41.1 111.5 228.6 92.1 51.1 101.8 193.4 97.2 136.5 23.2 173.4 64.3 29.1 27.3 66.1 137.1 240.9 95.9 233.6 126.9 295.5 62.8 92.2 Gross Price/ Profit Earnings Margin Ratio (%) 8.4 36.7 6.2 59.3 14.6 44.8 7.2 23.8 38.0 53.3 33.5 4.1 35.8 35.9 26.8 37.6 18.7 23.6 15.9 36.4 18.9 59.5 20.7 35.7 8.8 9.6 22.1 30.8 9.7 16.3 7.4 73.4 11.0 29.6 26.9 30.6 3.6 52.1 6.1 19.4 45.6 53.6 7.9 25.8 68.2 60.7 20.5 45.5 22.9 74.2 OTC OTC OTC a. c. How many variables are in the data set? b. Which of the variables are categorical and which are quantitative? For the Exchange variable, show the frequency and the percent frequency for AMEX, NYSE, and OTC. Construct a bar graph similar to Figure 1.4 for the Exchange variable. d. Show the frequency distribution for the Gross Profit Margin using the five intervals: 014.9, 1529.9, 3044.9, 4559.9, and 6074.9. Construct a histogram similar to Figure 1.5. What is the average price/earnings ratio? e. PE Ratio 8.4 6.2 14.6 7.2 20.5 22.9 GP Margin% 36.7 59.3 44.8 23.8 45.5 74.2 35 Problem 25, p. 33 36 Company Exchange Ticker Market Cap 37 De Wolfe Companies AMEX DWL 36.4 38 North Coast Energy OTC NCEB 52.5 39 Hansen Natural Corp. OTC HANS 41.1 40 Marine Max, Inc. NYSE HZO 111.5 60 Artesian Resources COTC ARTNA 62.8 61 York Water Company OTC YORW 92.2 62 (Rows 39-57 are hidden from view) 63 64 a) 65 b) 66 67 68 c) Exchange Frequency % Frequency 69 AMEX 70 NYSE 71 OTC 72 Total 0 0% 73 74 % Frequency 75 120% 76 100% 77 78 79 60% 80 40% 81 20% 82 0% 83 AMEX NYSE 84 85 d) Gross Profit Margin Upper Limit Frequency 86 0-14.9 14.9 87 15-29.9 29.9 88 30-44.9 44.9 89 45-59.9 59.9 90 60-74.9 74.9 91 0 80% OTC 92 Histogram e) Average PE Ratio = 93 94 95 96 97 98 99 100 101 102 103 GPM Ranges 0 0-14.9 15-29.9 30-44.9 45-59.9 60-74.9 Frequency
Step by Step Solution
There are 3 Steps involved in it

Get step-by-step solutions from verified subject matter experts