

Question: The following table shows a data set containing information for 25 of the shadow stocks tracked by the American Association of Individual Investors. Shadow stocks
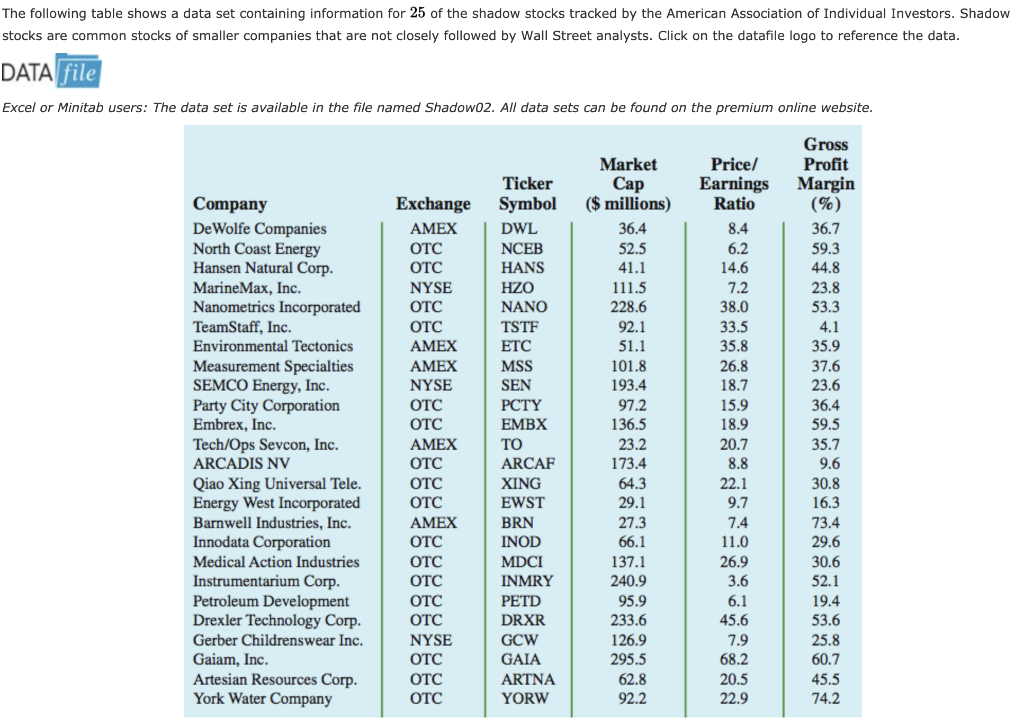
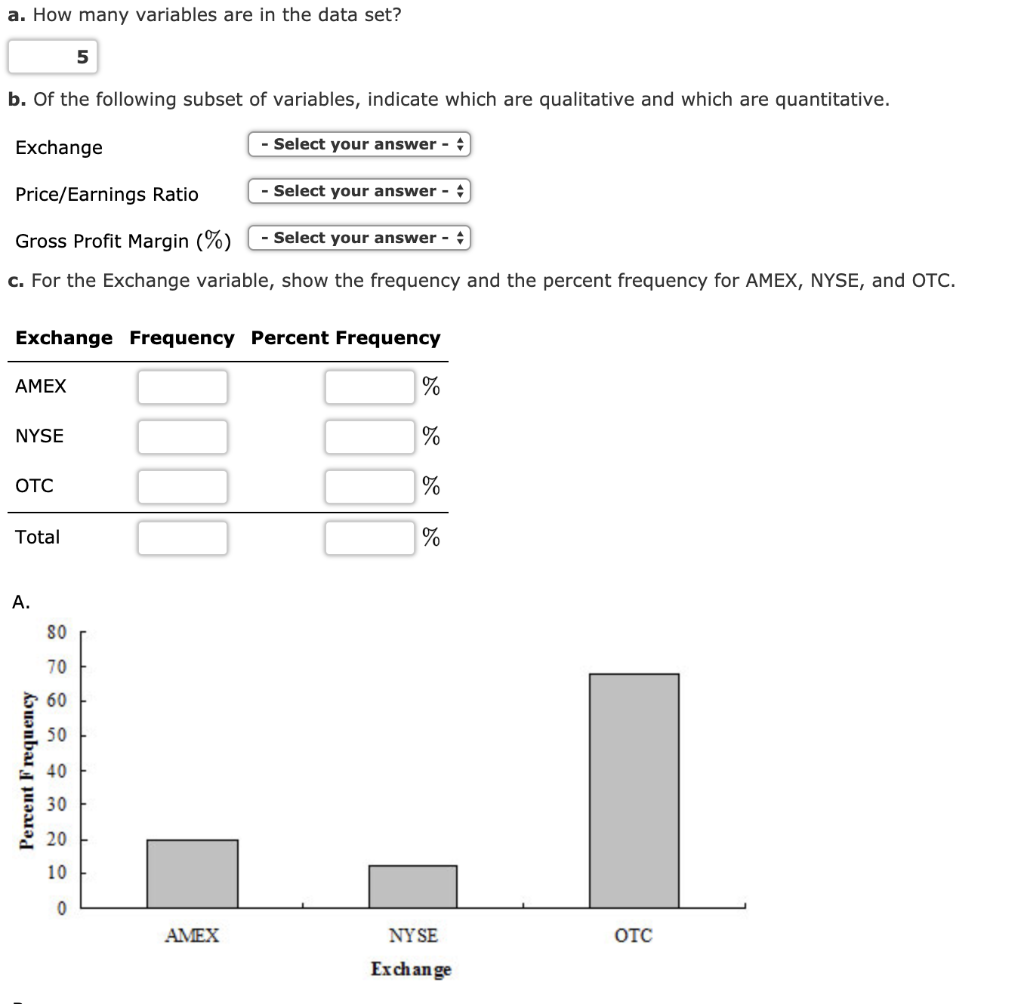
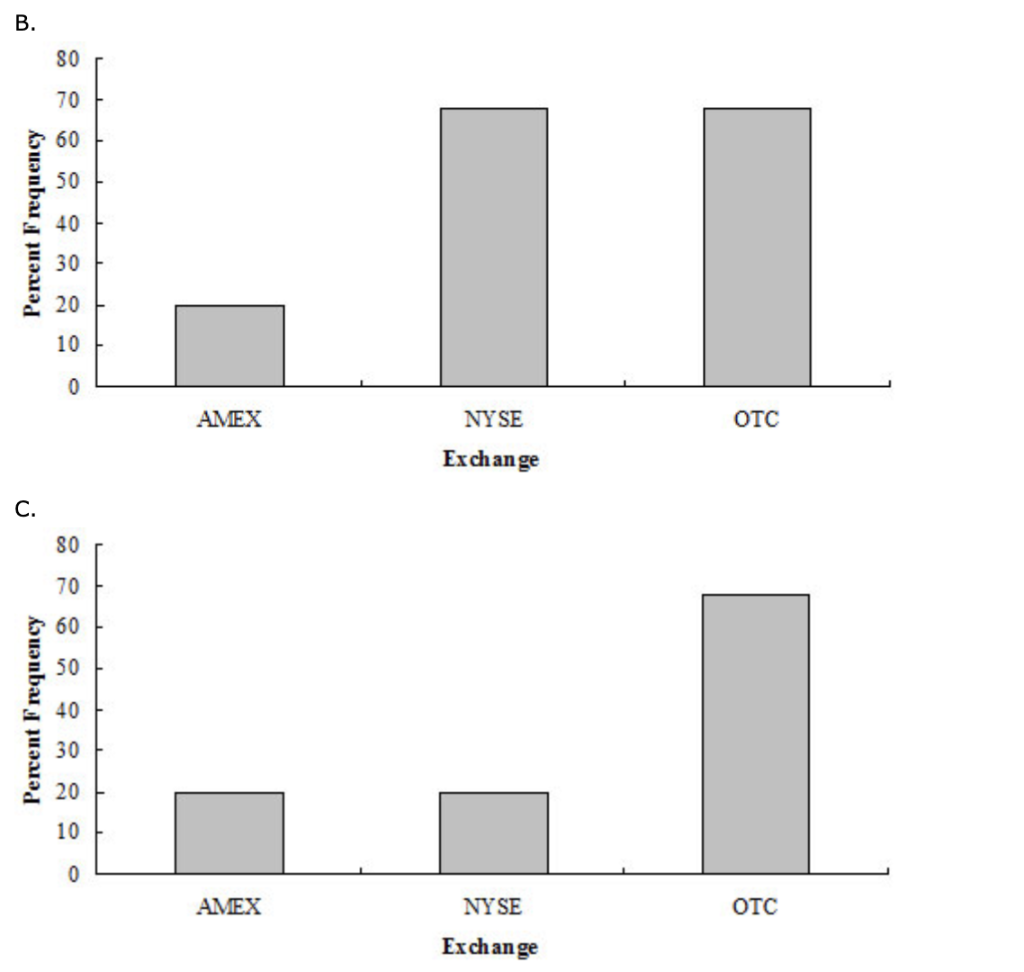
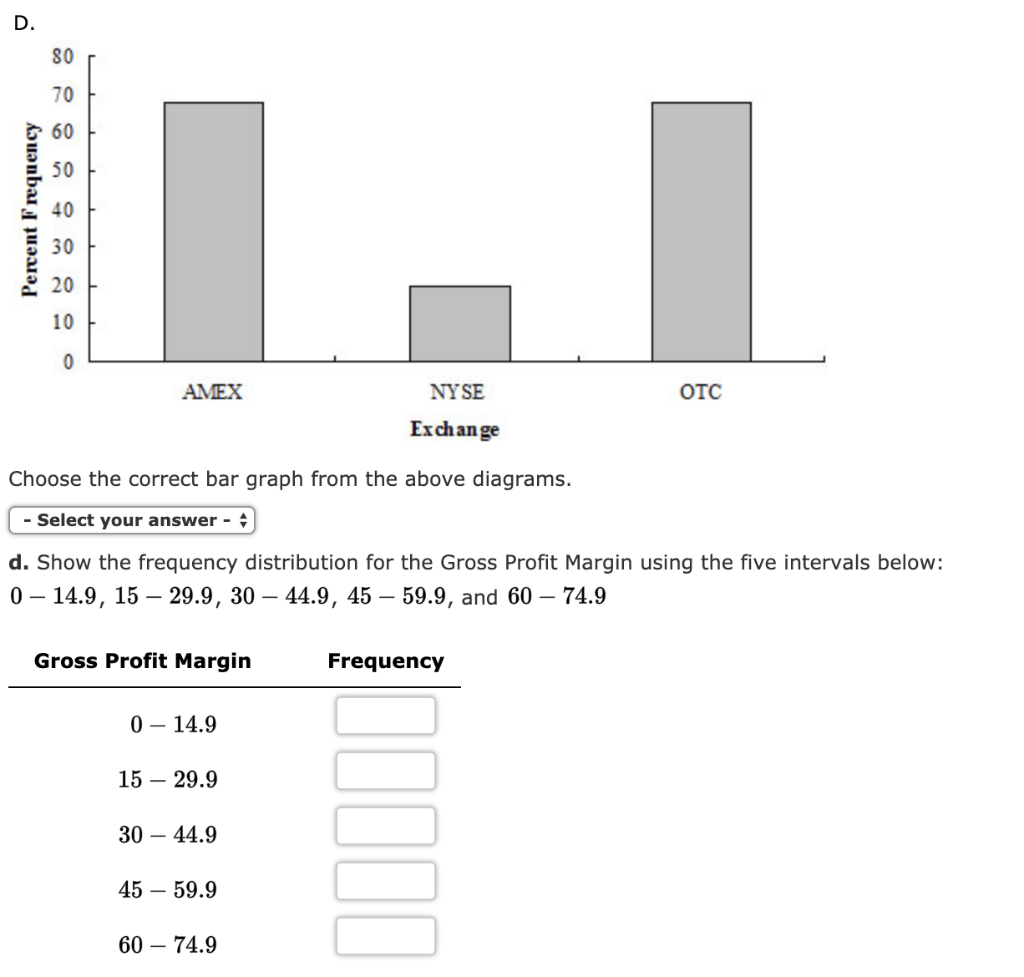
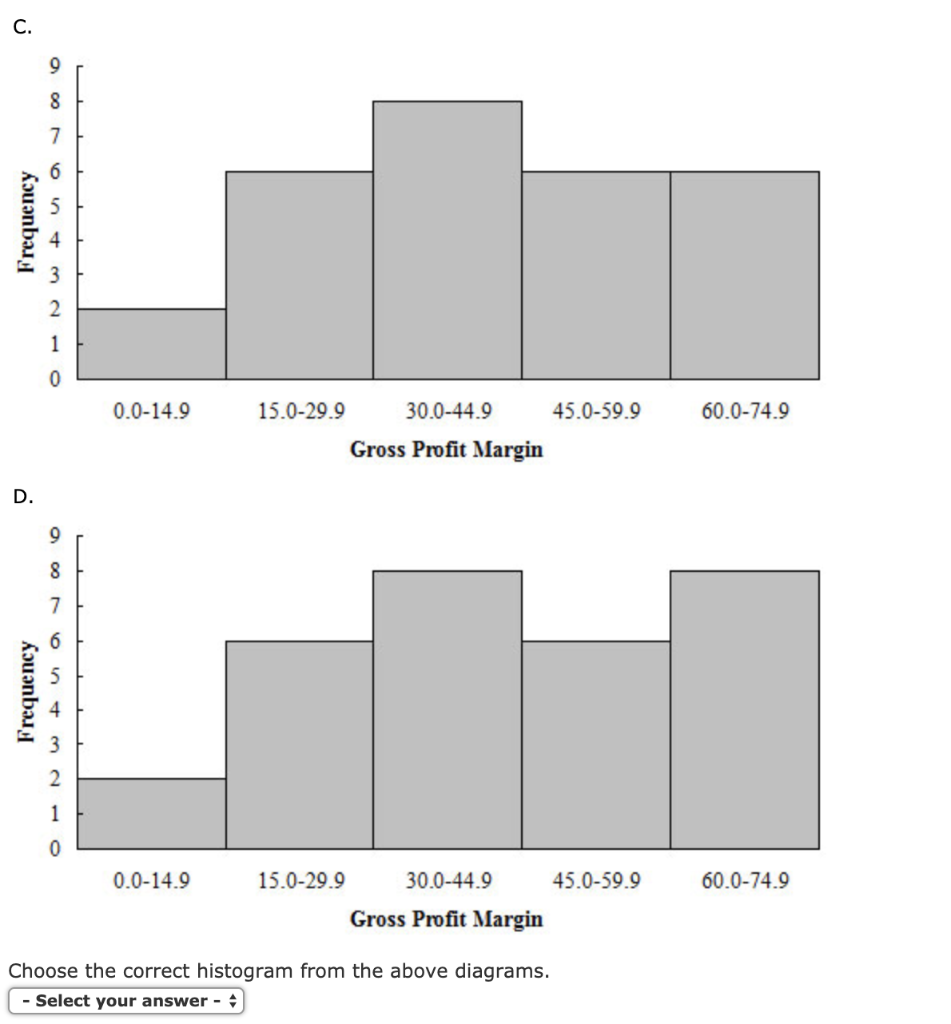
The following table shows a data set containing information for 25 of the shadow stocks tracked by the American Association of Individual Investors. Shadow stocks are common stocks of smaller companies that are not closely followed by Wall Street analysts. Click on the datafile logo to reference the data. DATA file Excel or Minitab users: The data set is available in the file named Shadowo2. All data sets can be found on the premium online website. Pricel Earnings Ratio 8.4 Gross Profit Margin (%) 36.7 Market Cap ($ millions) 36.4 52.5 41.1 111.5 228.6 92.1 6.2 59.3 44.8 14.6 7.2 38.0 51.1 Exchange AMEX OTC OTC NYSE OTC OTC AMEX AMEX NYSE OTC OTC AMEX OTC OTC OTC AMEX 33.5 35.8 26.8 23.8 53.3 4.1 35.9 37.6 23.6 36.4 59.5 Company De Wolfe Companies North Coast Energy Hansen Natural Corp. Marine Max, Inc. Nanometrics Incorporated TeamStaff, Inc. Environmental Tectonics Measurement Specialties SEMCO Energy, Inc. Party City Corporation Embrex, Inc. Tech/Ops Sevcon, Inc. ARCADIS NV Qiao Xing Universal Tele. Energy West Incorporated Barnwell Industries, Inc. Innodata Corporation Medical Action Industries Instrumentarium Corp. Petroleum Development Drexler Technology Corp. Gerber Childrenswear Inc. Gaiam, Inc. Artesian Resources Corp. York Water Company 18.7 Ticker Symbol DWL NCEB HANS HZO NANO TSTF ETC MSS SEN PCTY EMBX TO ARCAF XING EWST BRN INOD MDCI INMRY PETD DRXR GCW GAIA ARTNA YORW 101.8 193.4 97.2 136.5 23.2 15.9 18.9 20.7 35.7 173.4 8.8 22.1 9.7 9.6 30.8 16.3 1.4 73.4 OTC 11.0 26.9 64.3 29.1 27.3 66.1 137.1 240.9 95.9 233.6 126.9 295.5 62.8 92.2 29.6 30.6 52.1 19.4 OTC OTC OTC OTC NYSE OTC OTC OTC 45.6 53.6 7.9 68.2 20.5 22.9 25.8 60.7 45.5 74.2 a. How many variables are in the data set? b. Of the following subset of variables, indicate which are qualitative and which are quantitative. Exchange - Select your answer - Price/Earnings Ratio - Select your answer - Gross Profit Margin (%) - Select your answer - 4 c. For the Exchange variable, show the frequency and the percent frequency for AMEX, NYSE, and OTC. Exchange Frequency Percent Frequency AMEX NYSE OTC Total Percent Frequency AMEX OTC NY SE Exchange Percent Frequency AMEX NYSE OTC Exchange Percent Frequency AMEX NYSE OTC Exchange Percent Frequency AMEX NY SE Exchange Choose the correct bar graph from the above diagrams. ( - Select your answer - 4 d. Show the frequency distribution for the Gross Profit Margin using the five intervals below: 0 14.9, 15 29.9, 30 44.9, 45 59.9, and 60 74.9 Gross Profit Margin Frequency 0 14.9 15 29.9 30 44.9 45 59.9 60 74.9 Frequency 0.0-14.9 45.0-59.9 60.0-74.9 15.0-29.9 30.0-44.9 Gross Profit Margin Frequency 0.0-14.9 45.0-59.9 60.0-74.9 15.0-29.9 30.0-44.9 Gross Profit Margin Choose the correct histogram from the above diagrams. - Select your answer - e. What is the average price/earnings ratio (to 1 decimal)
Step by Step Solution
There are 3 Steps involved in it

Get step-by-step solutions from verified subject matter experts