

Question: 6.9. The data shown in Table 6E.4 are the deviations from nominal diameter for holes drilled in a carbon-fiber composite material used in aerospace manufacturing.
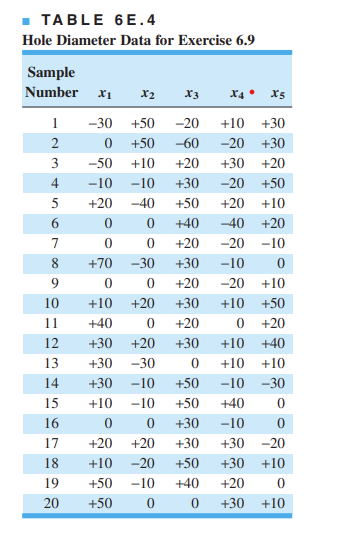
6.9. The data shown in Table 6E.4 are the deviations from nominal diameter for holes drilled in a carbon-fiber composite material used in aerospace manufacturing. The values reported are deviations from nominal in ten-thousandths of an inch. (a) Set up x and R charts on the process. Is the process in statistical control? (b) Estimate the process standard deviation using the range method. - TABLE 6 E.4 Hole Diameter Data for Exercise 6.9 \begin{tabular}{crrrrr} \hline SampleNumber & x1 & x2 & x3 & x4x5 \\ \hline 1 & -30 & +50 & -20 & +10 & +30 \\ 2 & 0 & +50 & -60 & -20 & +30 \\ \hline 3 & -50 & +10 & +20 & +30 & +20 \\ 4 & -10 & -10 & +30 & -20 & +50 \\ \hline 5 & +20 & -40 & +50 & +20 & +10 \\ 6 & 0 & 0 & +40 & -40 & +20 \\ \hline 7 & 0 & 0 & +20 & -20 & -10 \\ 8 & +70 & -30 & +30 & -10 & 0 \\ \hline 9 & 0 & 0 & +20 & -20 & +10 \\ 10 & +10 & +20 & +30 & +10 & +50 \\ \hline 11 & +40 & 0 & +20 & 0 & +20 \\ 12 & +30 & +20 & +30 & +10 & +40 \\ 13 & +30 & -30 & 0 & +10 & +10 \\ 14 & +30 & -10 & +50 & -10 & -30 \\ 15 & +10 & -10 & +50 & +40 & 0 \\ 16 & 0 & 0 & +30 & -10 & 0 \\ \hline 17 & +20 & +20 & +30 & +30 & -20 \\ 18 & +10 & -20 & +50 & +30 & +10 \\ \hline 19 & +50 & -10 & +40 & +20 & 0 \\ 20 & +50 & 0 & 0 & +30 & +10 \\ \hline \end{tabular}
Step by Step Solution
There are 3 Steps involved in it

Get step-by-step solutions from verified subject matter experts