

Question: 7. (10 pts) Use linear regression to evaluate how well the data fits a linear relationship. See Excel tutorial available on Canvas for tips on
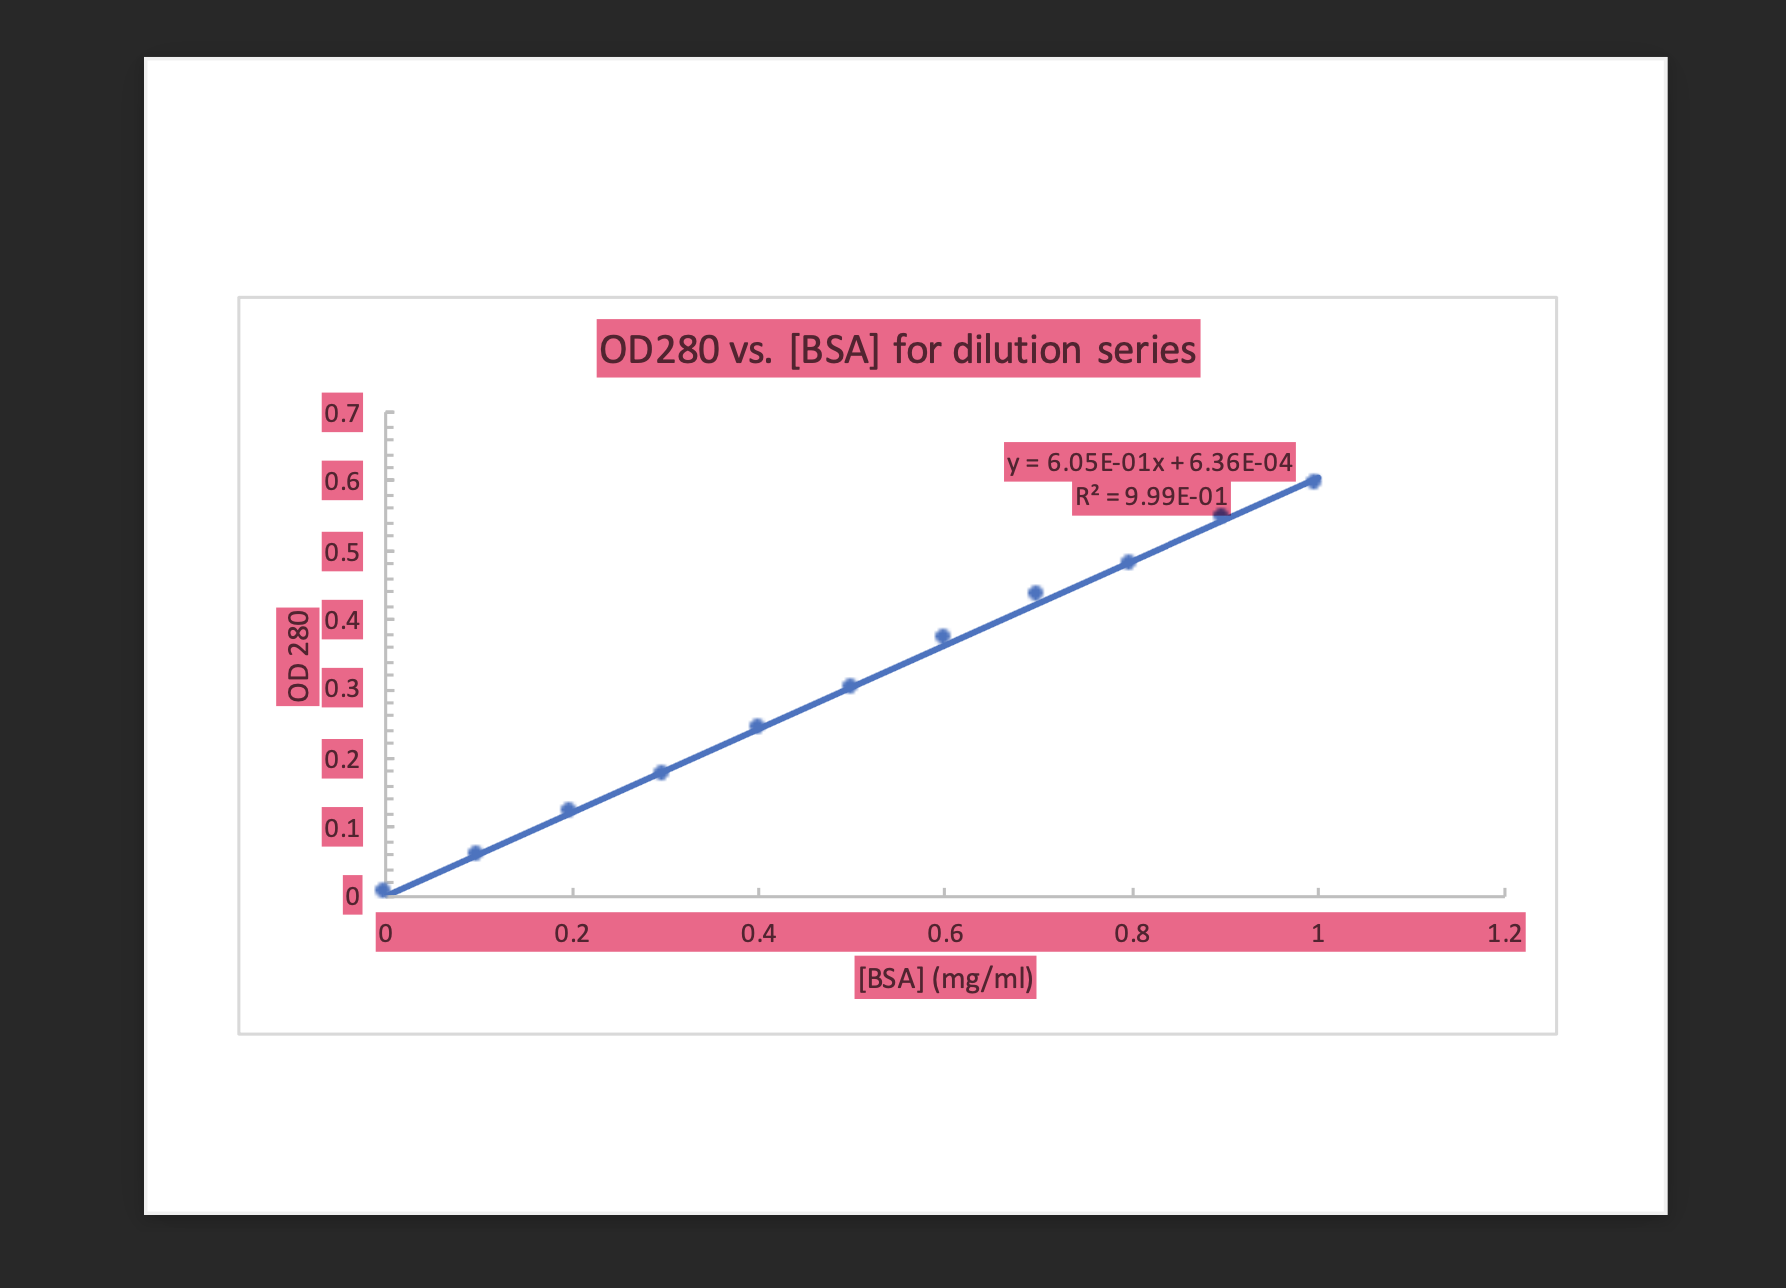
7. (10 pts) Use linear regression to evaluate how well the data fits a linear relationship. See Excel tutorial available on Canvas for tips on how to add a trendline, with regression equation to your chart.
8. (10 pts) Determine the extinction coefficient for BSA from this graph, relying on your trendline analysis
= =
Step by Step Solution
There are 3 Steps involved in it
1 Expert Approved Answer
Step: 1 Unlock

Question Has Been Solved by an Expert!
Get step-by-step solutions from verified subject matter experts
Step: 2 Unlock
Step: 3 Unlock