

Question: I attached 3 documents. Each problems needs to be calculated in an excel spreadsheet showing my work. As you can see, I did the work
I attached 3 documents. Each problems needs to be calculated in an excel spreadsheet showing my work. As you can see, I did the work but need to put each problem in the excel worksheet. Can you advise? THanks! PLEASE SEE ATTACHMENTS!!!
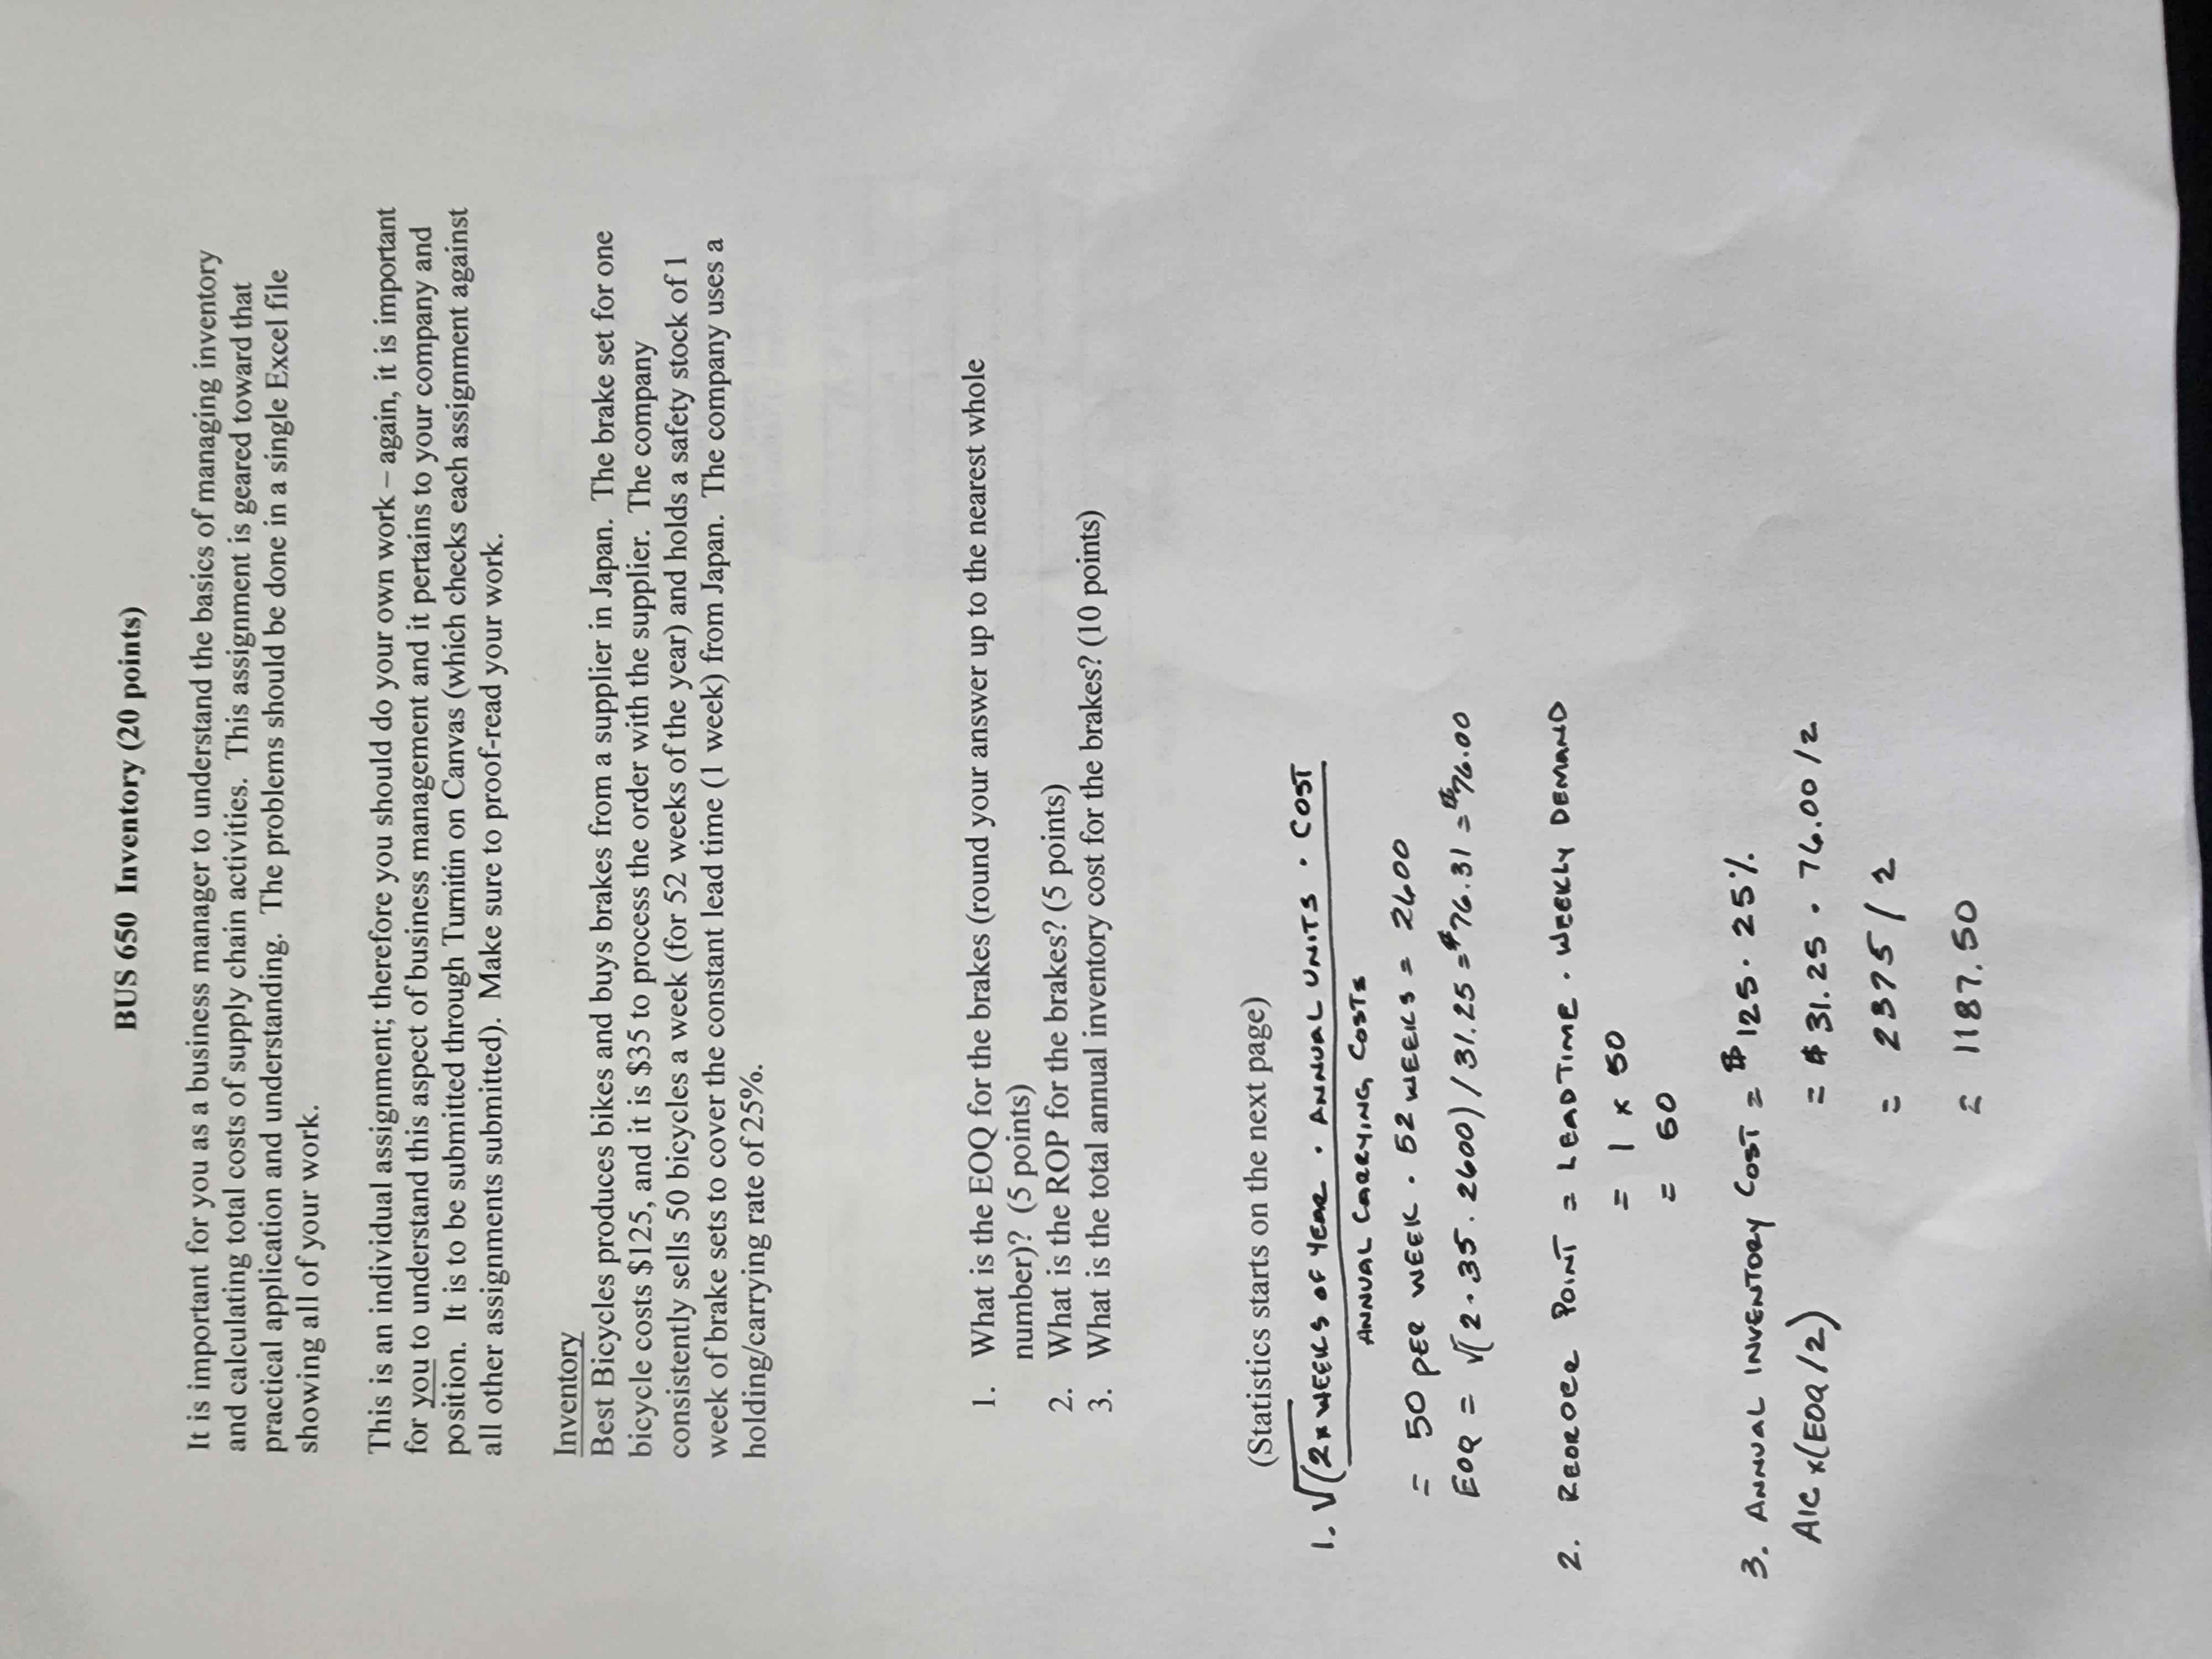
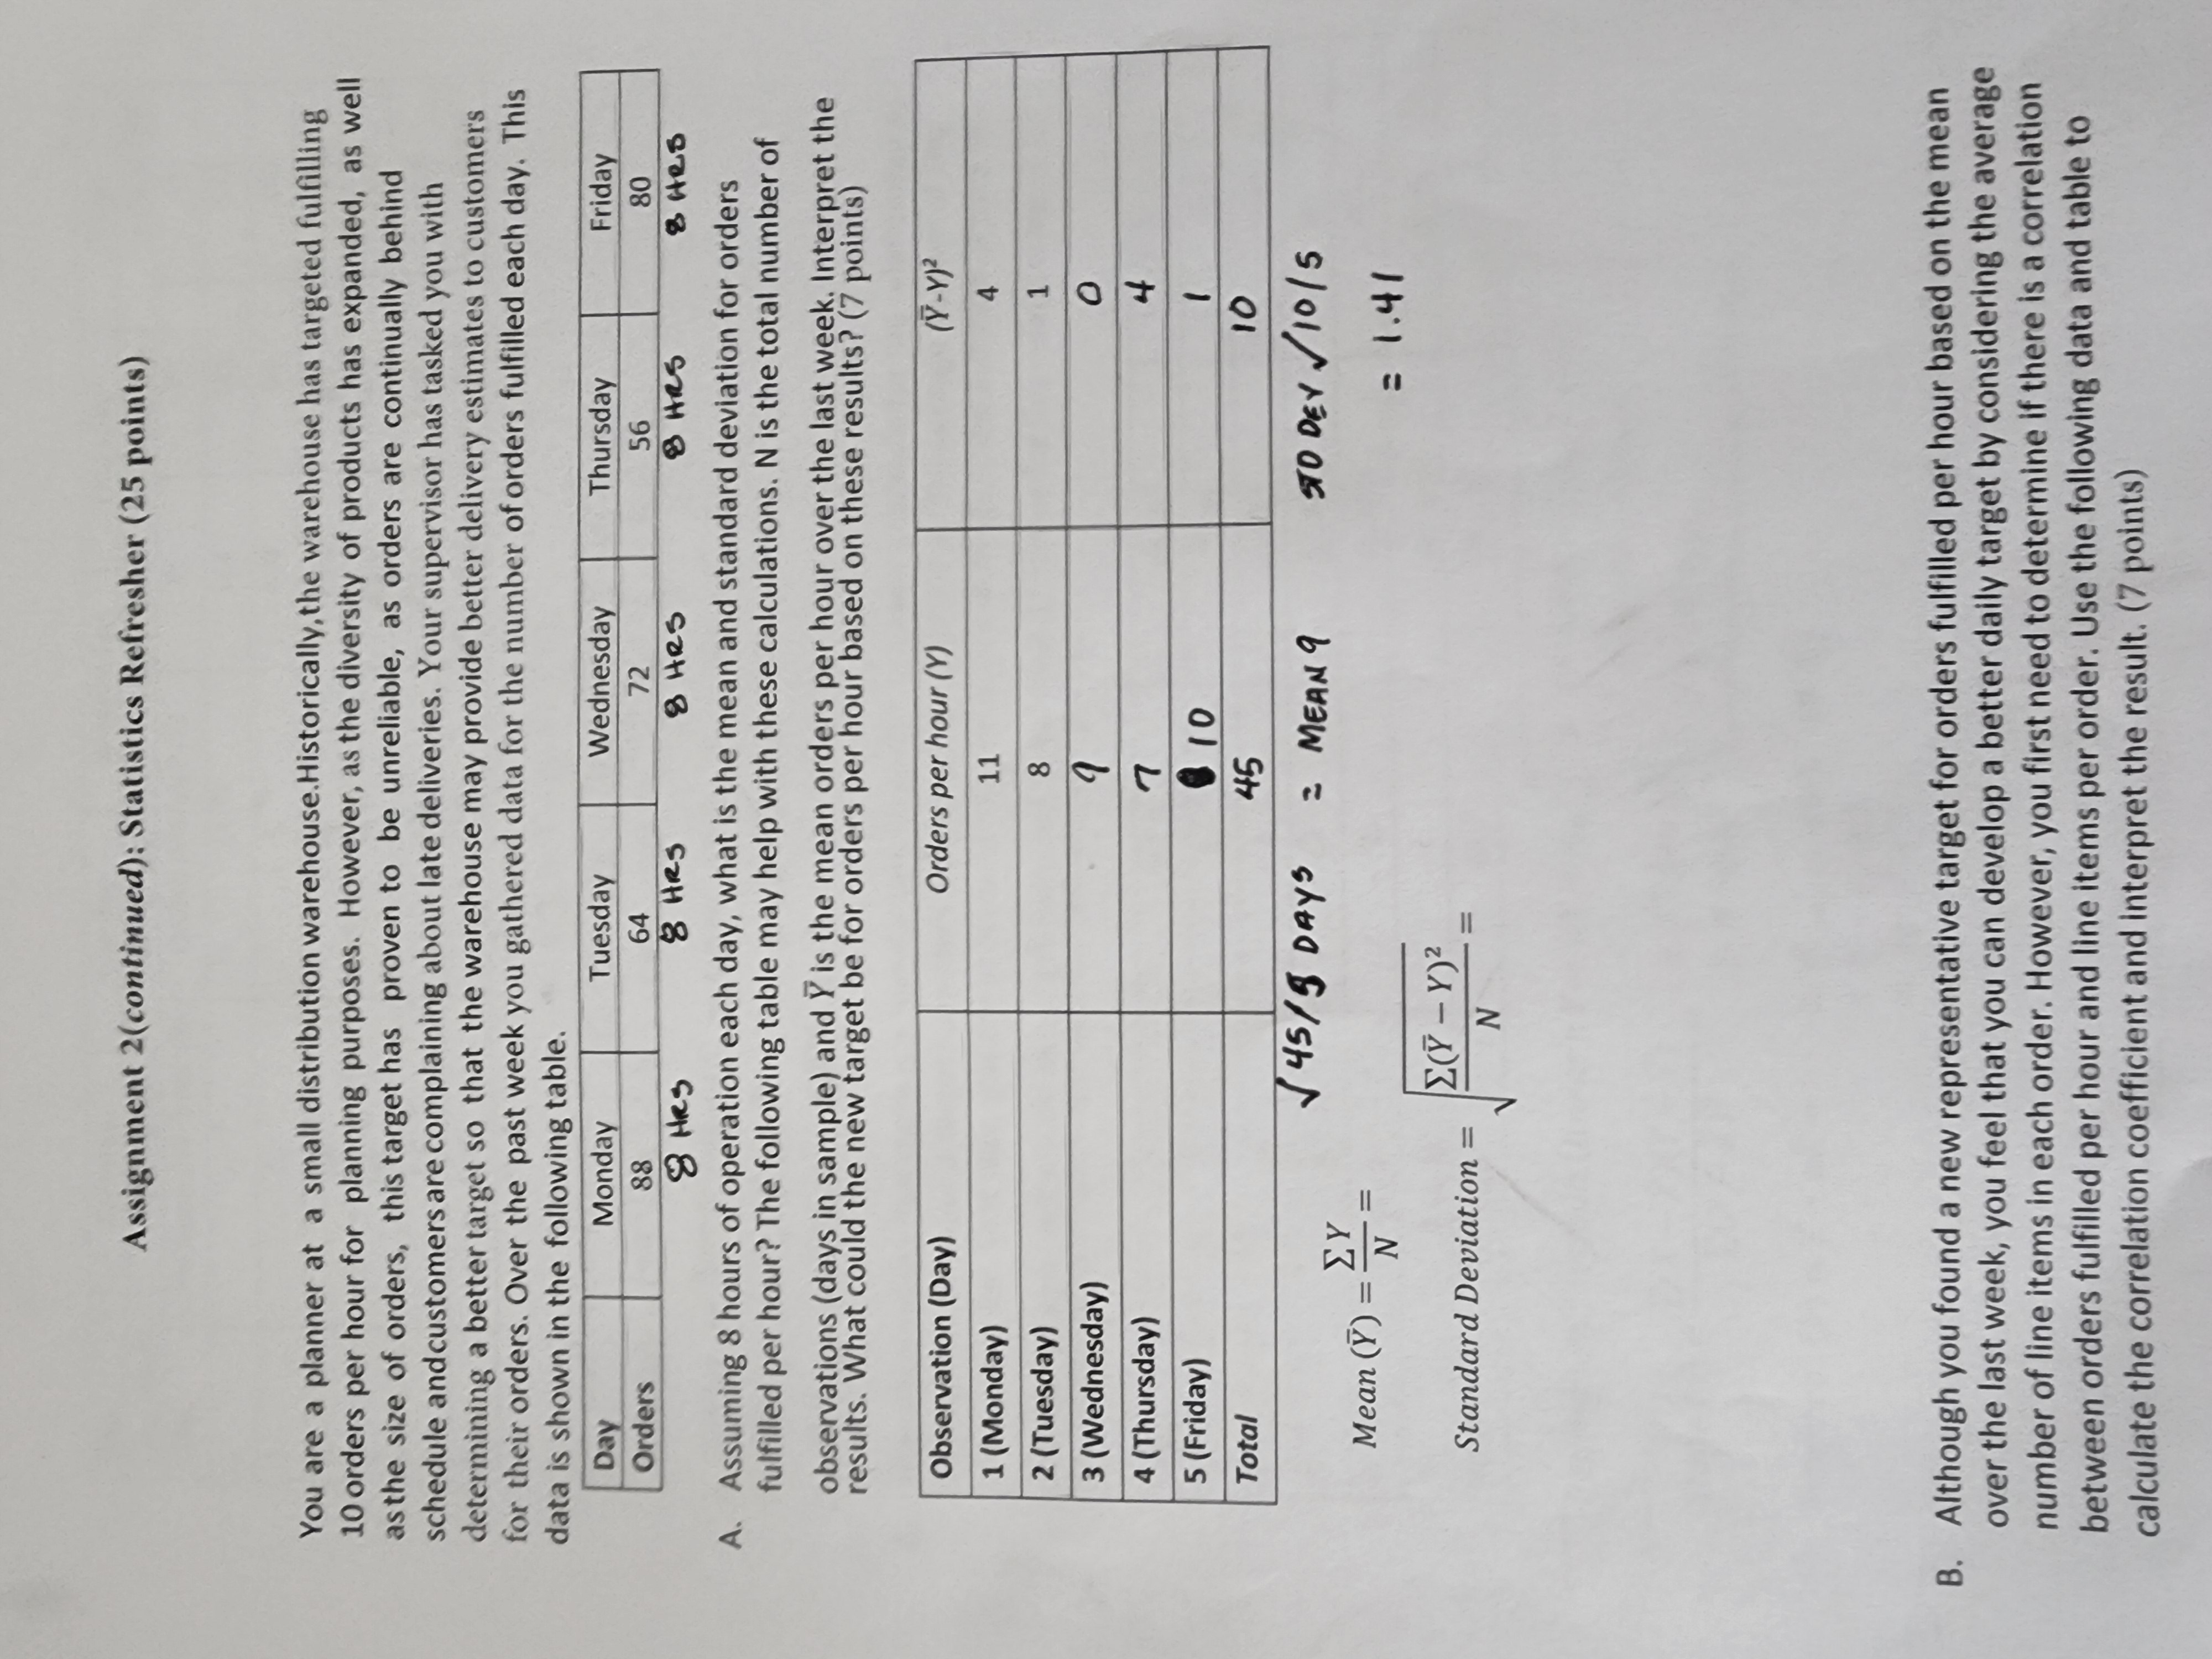
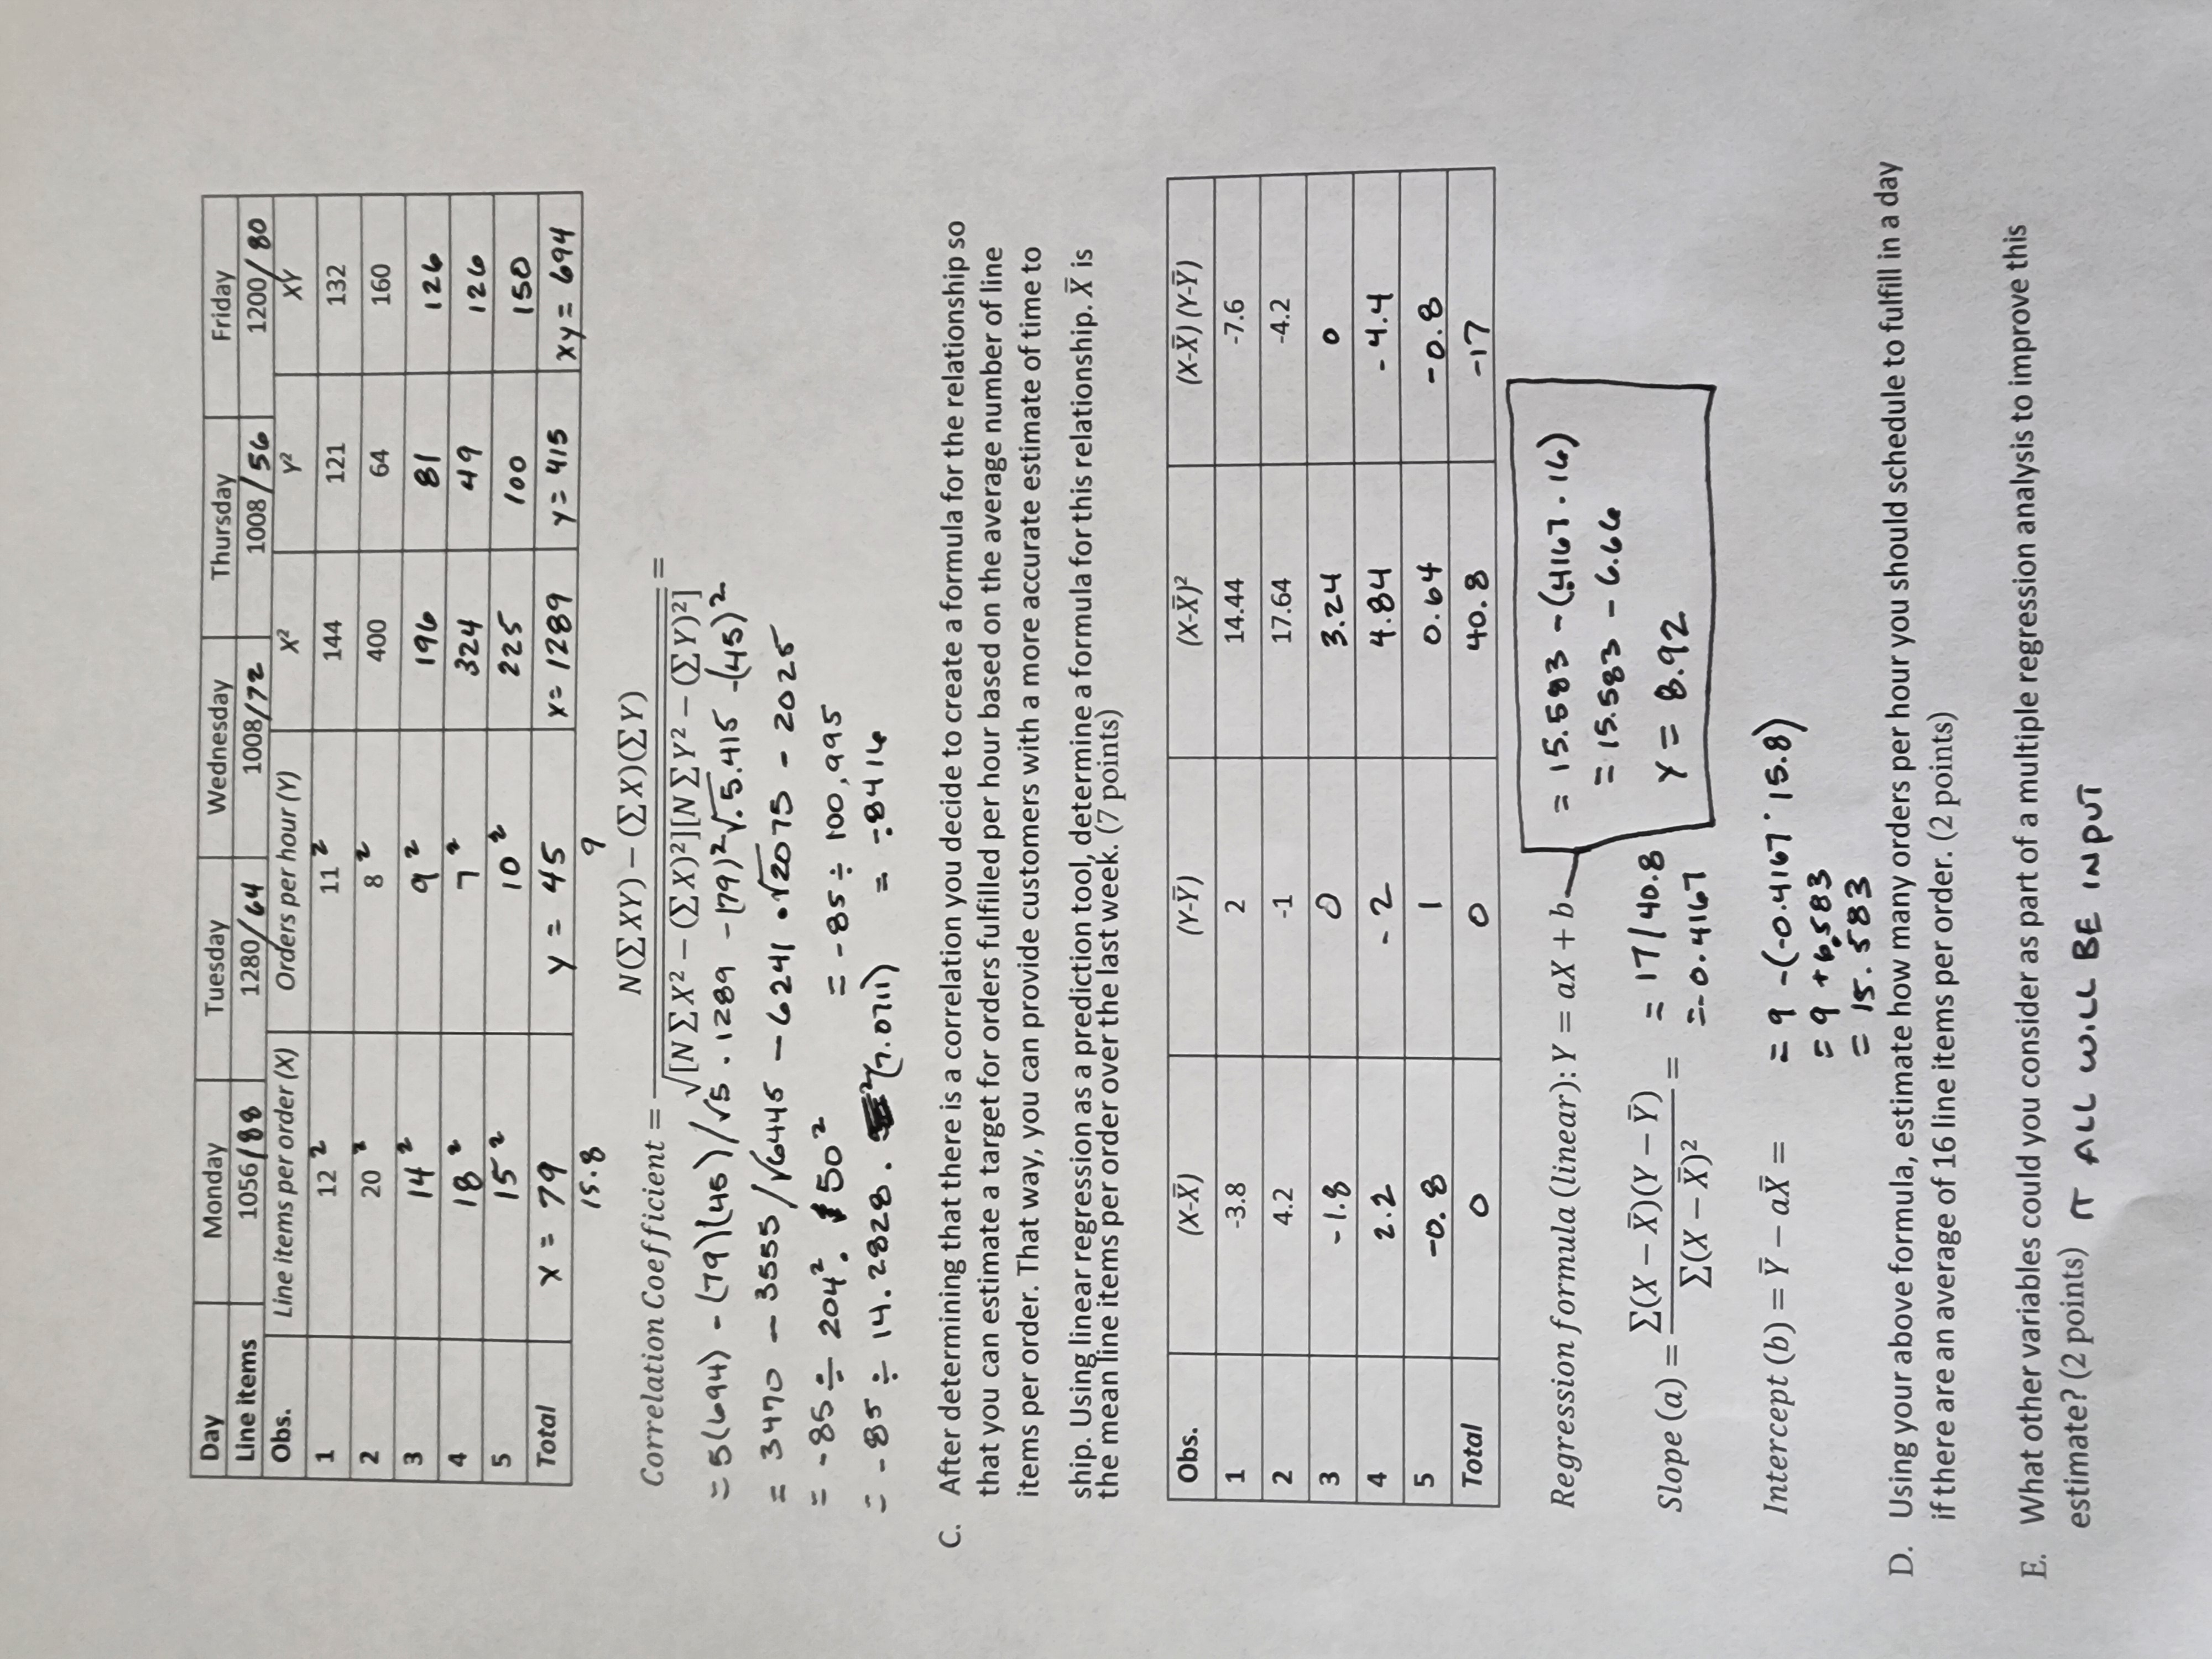
BUS 650 Inventory (20 points) It is important for you as a business manager to understand the basics of managing inventory and calculating total costs of supply chain activities. This assignment is geared toward that practical application and understanding. The problems should be done in a single Excel file showing all of your work. This is an individual assignment; therefore you should do your own work - again, it is important for you to understand this aspect of business management and it pertains to your company and position. It is to be submitted through Turnitin on Canvas (which checks each assignment against all other assignments submitted). Make sure to proof-read your work. Inventory Best Bicycles produces bikes and buys brakes from a supplier in Japan. The brake set for one bicycle costs $125, and it is $35 to process the order with the supplier. The company consistently sells 50 bicycles a week (for 52 weeks of the year) and holds a safety stock of 1 week of brake sets to cover the constant lead time (1 week) from Japan. The company uses a holding/carrying rate of 25%. 1. What is the EOQ for the brakes (round your answer up to the nearest whole number)? (5 points) 2. What is the ROP for the brakes? (5 points) 3. What is the total annual inventory cost for the brakes? (10 points) Statistics starts on the next page) 1. V ( 2 x WEEKS OF YEAR . ANNUAL UNITS . COST ANNUAL CARRYING COSTS - 50 PER WEEK . 52 WEEKS = 2600 EOQ = (/ 2 . 35. 2600) / 31.25 = $76.31 =$ 96.00 2. REDROCK POINT = LEADTIME . WEEKLY DEMAND = 1 X 50 60 3. ANNUAL INVENTORY COST 2 125. 25% AIC x (EDQ / 2) = $ 31. 25 . 76.00 / 2 = 2375 / 2 2 1187. 50Assignment 2(continued): Statistics Refresher (25 points) You are a planner at a small distribution warehouse.Historically, the warehouse has targeted fulfilling 10 orders per hour for planning purposes. However, as the diversity of products has expanded, as well as the size of orders, this target has proven to be unreliable, as orders are continually behind schedule and customers are complaining about late deliveries. Your supervisor has tasked you with determining a better target so that the warehouse may provide better delivery estimates to customers for their orders. Over the past week you gathered data for the number of orders fulfilled each day. This data is shown in the following table. Day Monday Tuesday Wednesday Thursday Friday Orders 88 64 72 56 80 8 Hes 8 HRS 8 HRS 8 HRS 8 Hes A. Assuming 8 hours of operation each day, what is the mean and standard deviation for orders fulfilled per hour? The following table may help with these calculations. N is the total number of observations (days in sample) and Y is the mean orders per hour over the last week. Interpret the results. What could the new target be for orders per hour based on these results? (7 points) Observation (Day) Orders per hour (Y) ( Y - V ) ? 1 (Monday) 11 4 2 (Tuesday) 8 1 3 (Wednesday) 9 O 4 (Thursday) 7 5 (Friday) 6 10 1- Total 45 10 1 45/5 DAYS = MEAN 9 STO DEY/ 10 /5 EY Mean (Y) = N = 1.41 [( Y - Y) 2 Standard Deviation = N B. Although you found a new representative target for orders fulfilled per hour based on the mean over the last week, you feel that you can develop a better daily target by considering the average number of line items in each order. However, you first need to determine if there is a correlation between orders fulfilled per hour and line items per order. Use the following data and table to calculate the correlation coefficient and interpret the result. (7 points)Day Monday Tuesday Wednesday Thursday Line items Friday 1056/8% 1280/64 1008/72 1008 /56 Obs. 1200/ 80 Line items per order (X) Orders per hour (Y) x2 Yz xY 1 12 2 11 2 144 121 132 2 20 8 2 400 64 160 3 14 2 196 81 126 4 182 7 324 4 9 5 15 2 126 10 2 225 100 150 Total x = 79 y = 45 x = 1289 y = 415 xy = 694 15 . 8 9 Correlation Coefficient =- NCE XY ) - (EX) (EY) [NEX2 -(EX)2][NEY2 - (CY)2] - 5 (694) - (79)(45 ) / 15. 1289 -179)21. 5.415-(45)2 = 3470 - 3535/16445- 6241 - 12075 - 2025 = - 85 # 2042 1502 = - 85: 100, 995 - - 85: 14. 2828. "(7.0711) =:8414 C. After determining that there is a correlation you decide to create a formula for the relationship so that you can estimate a target for orders fulfilled per hour based on the average number of line items per order. That way, you can provide customers with a more accurate estimate of time to ship. Using linear regression as a prediction tool, determine a formula for this relationship. X is the mean line items per order over the last week. (7 points) Obs. X-X) ( Y- Y) ( X-X ) ? (X-X) ( Y- Y) 1 -3.8 2 14.44 7.6 2 4.2 -1 17.64 4.2 3 - 1.8 3.24 O 4 2. 2 - 2 4.84 - 4.4 5 -0. 8 1 0. 64 - 0 . 8 Total 0 O 40.8 -17 Regression formula (linear): Y = ax + b = 15.583 - (4167 . 16) = 15.583 - 6.64 Slope (a) = E( X - X) ( Y - V) = 17/40.8 E ( X - X) 2 = - 0. 4167 Y = 8.92 Intercept (b) = Y - ax = =9 -(-0.4167 . 15.8) =9+6583 = 15. 583 D. Using your above formula, estimate how many orders per hour you should schedule to fulfill in a day if there are an average of 16 line items per order. (2 points) E. What other variables could you consider as part of a multiple regression analysis to improve this estimate? (2 points) It ALL WILL BE INPUT
Step by Step Solution
There are 3 Steps involved in it

Get step-by-step solutions from verified subject matter experts