

Question: 7 11 Based on the graph above, which statement best describes the graph? Answer O The two distributions have means that differ by 4 units
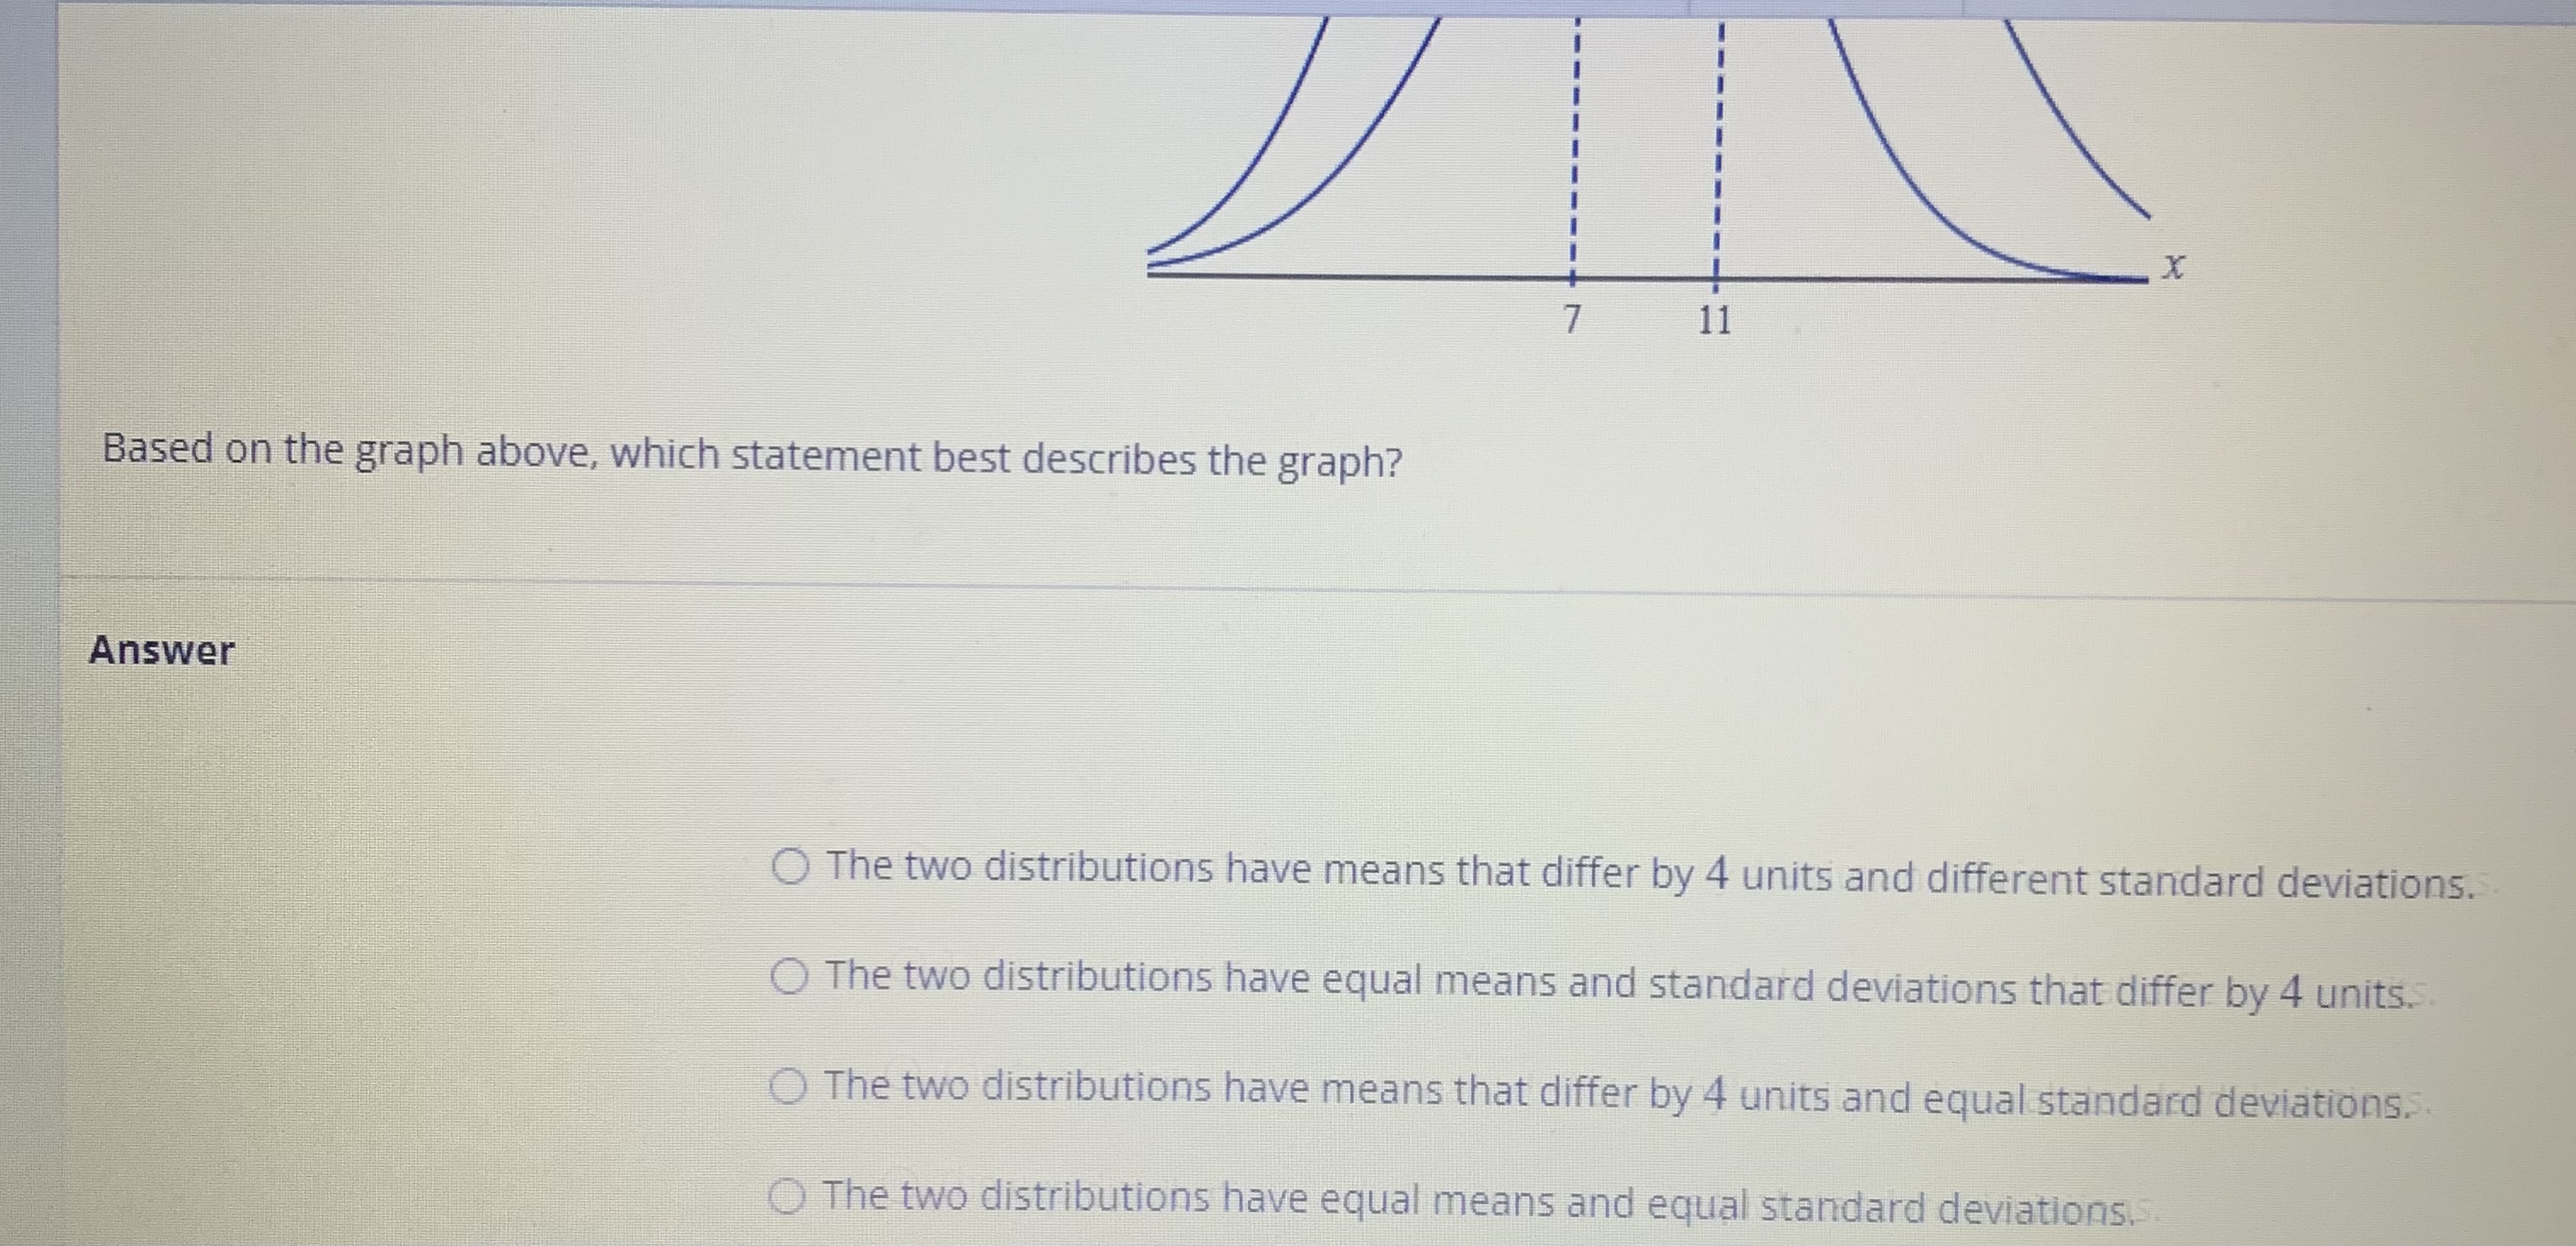


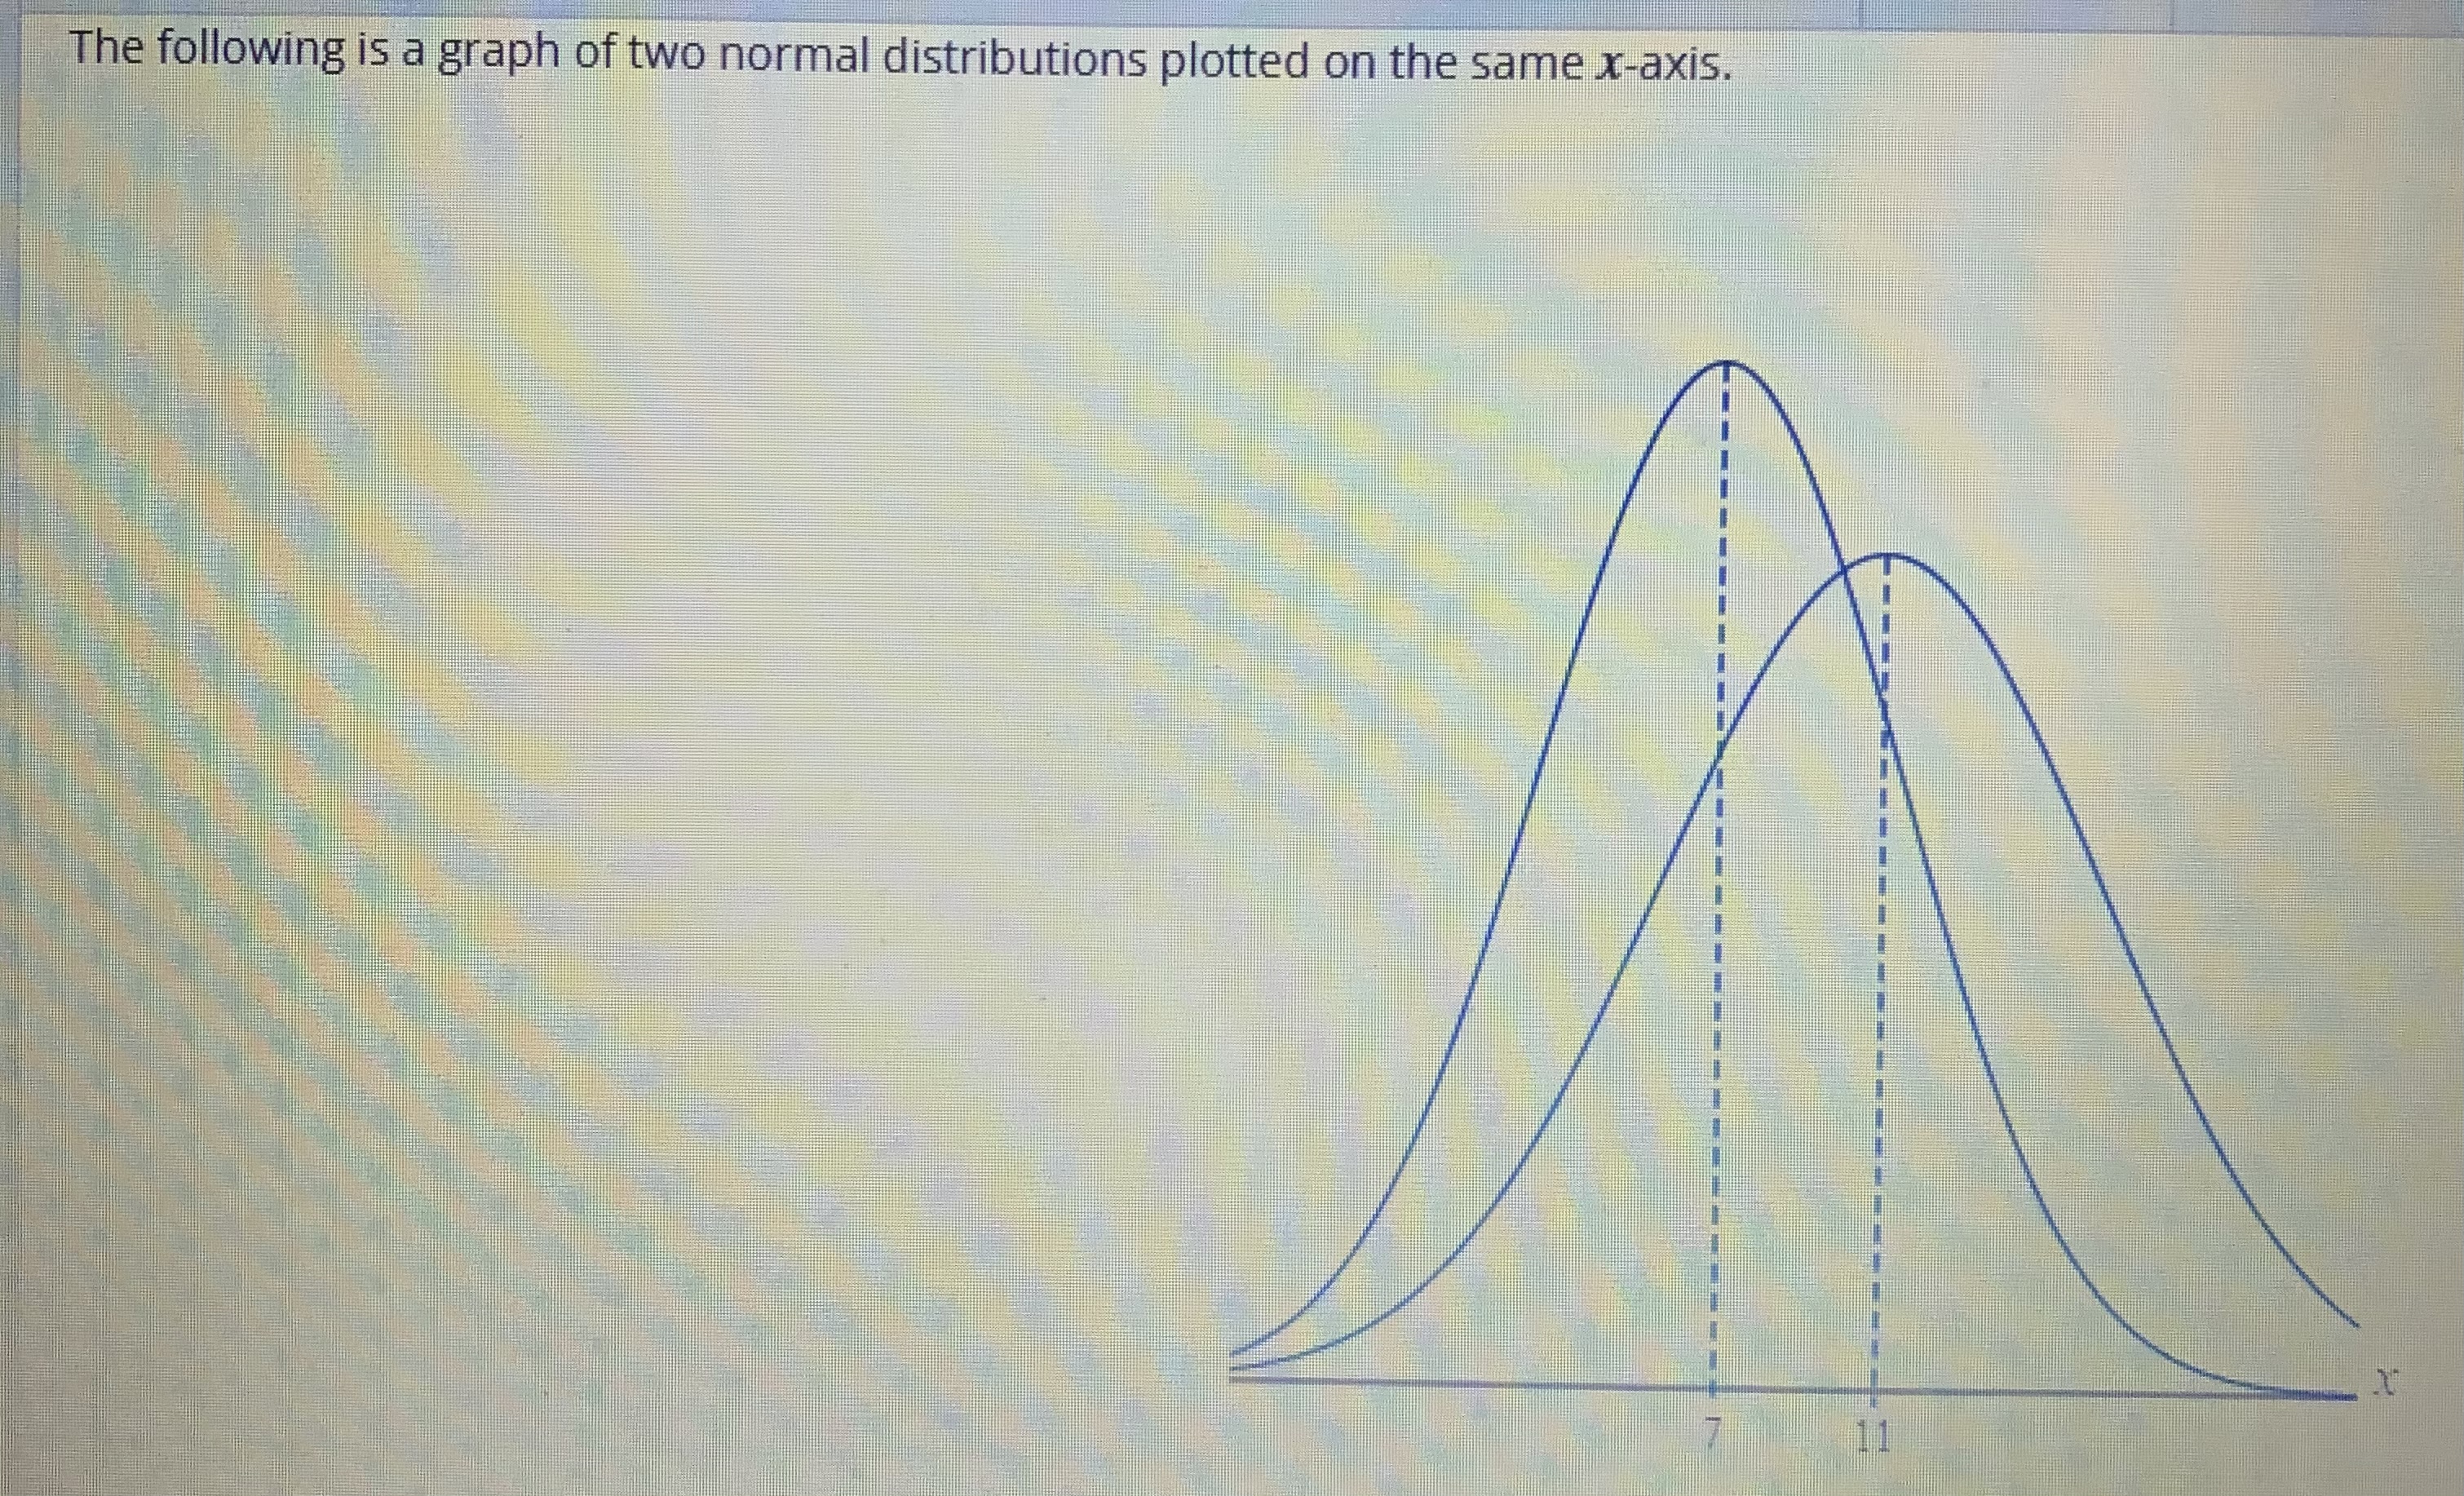
7 11 Based on the graph above, which statement best describes the graph? Answer O The two distributions have means that differ by 4 units and different standard deviations. O The two distributions have equal means and standard deviations that differ by 4 units. O The two distributions have means that differ by 4 units and equal standard deviations. O The two distributions have equal means and equal standard deviations.The following is a graph of two normal distributions plotted on the same x-axis
Step by Step Solution
There are 3 Steps involved in it
1 Expert Approved Answer
Step: 1 Unlock

Question Has Been Solved by an Expert!
Get step-by-step solutions from verified subject matter experts
Step: 2 Unlock
Step: 3 Unlock