

Question: Correct 15 Based on the graph above, which statement best describes the graph? Answer Tables Key The two distributions have equal standard deviations and different
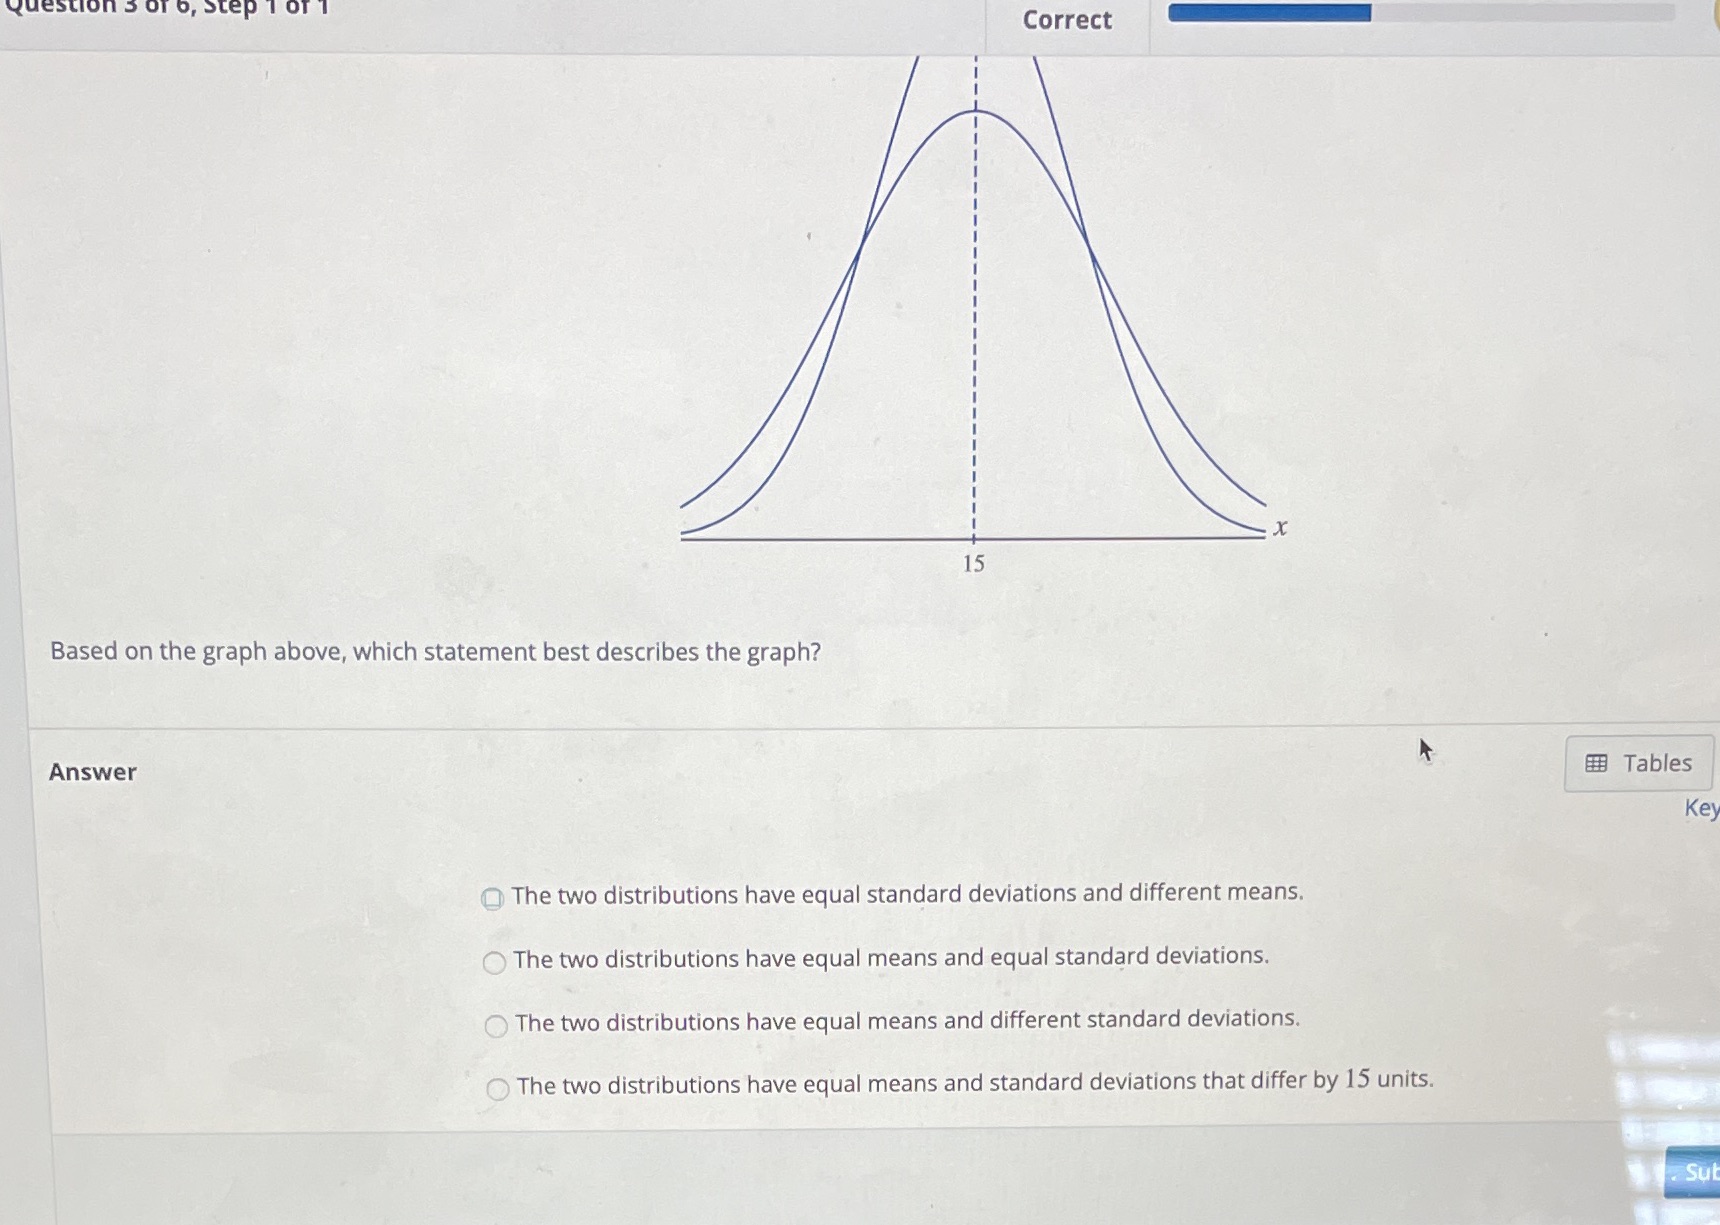
Correct 15 Based on the graph above, which statement best describes the graph? Answer Tables Key The two distributions have equal standard deviations and different means. The two distributions have equal means and equal standard deviations. The two distributions have equal means and different standard deviations. The two distributions have equal means and standard deviations that differ by 15 units. . Su
Step by Step Solution
There are 3 Steps involved in it
1 Expert Approved Answer
Step: 1 Unlock

Question Has Been Solved by an Expert!
Get step-by-step solutions from verified subject matter experts
Step: 2 Unlock
Step: 3 Unlock