

Question: 7 . A car is driven at a speed that is initially high and then decreases over time. Circle the graph below that could represent
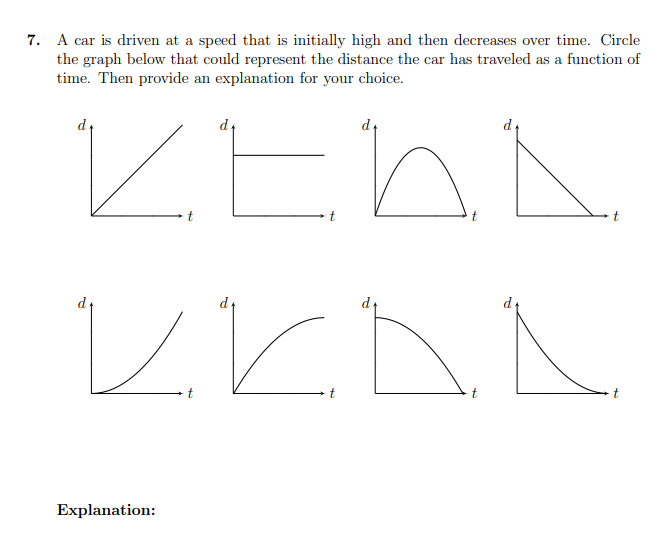
A car is driven at a speed that is initially high and then decreases over time. Circle the graph below that could represent the distance the car has traveled as a function of time. Then provide an explanation for your choice.
Explanation:
Step by Step Solution
There are 3 Steps involved in it
1 Expert Approved Answer
Step: 1 Unlock

Question Has Been Solved by an Expert!
Get step-by-step solutions from verified subject matter experts
Step: 2 Unlock
Step: 3 Unlock