

Question: A car is driven at a speed that is initially high and then decreases, starting at noon Which ofthe following could he a graph of

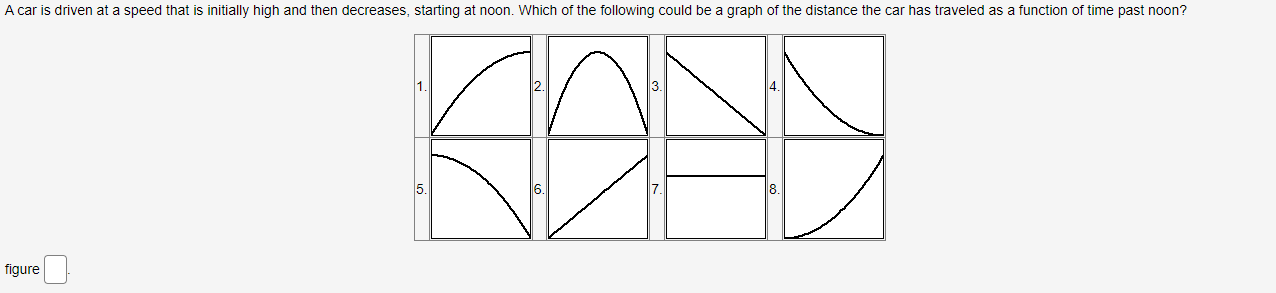
A car is driven at a speed that is initially high and then decreases, starting at noon Which ofthe following could he a graph of he distance the car has traveled as a function of time past noon? figure |:l_
Step by Step Solution
There are 3 Steps involved in it
1 Expert Approved Answer
Step: 1 Unlock

Question Has Been Solved by an Expert!
Get step-by-step solutions from verified subject matter experts
Step: 2 Unlock
Step: 3 Unlock