

Question: 7. After you have completed the titration, graph the data using MS Excel, following the instructions provided below. 8. Enter mLNaOH in the first column
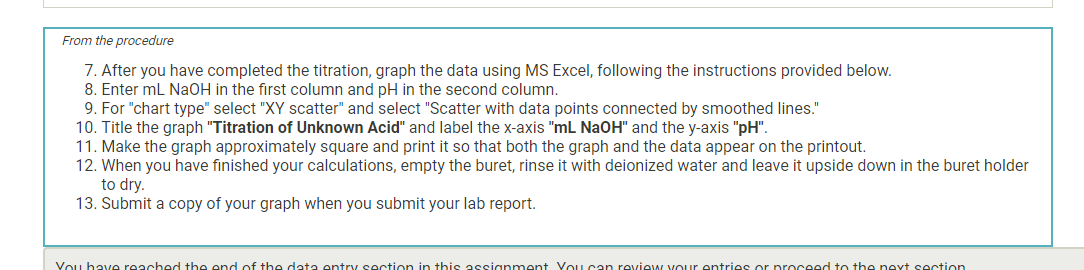
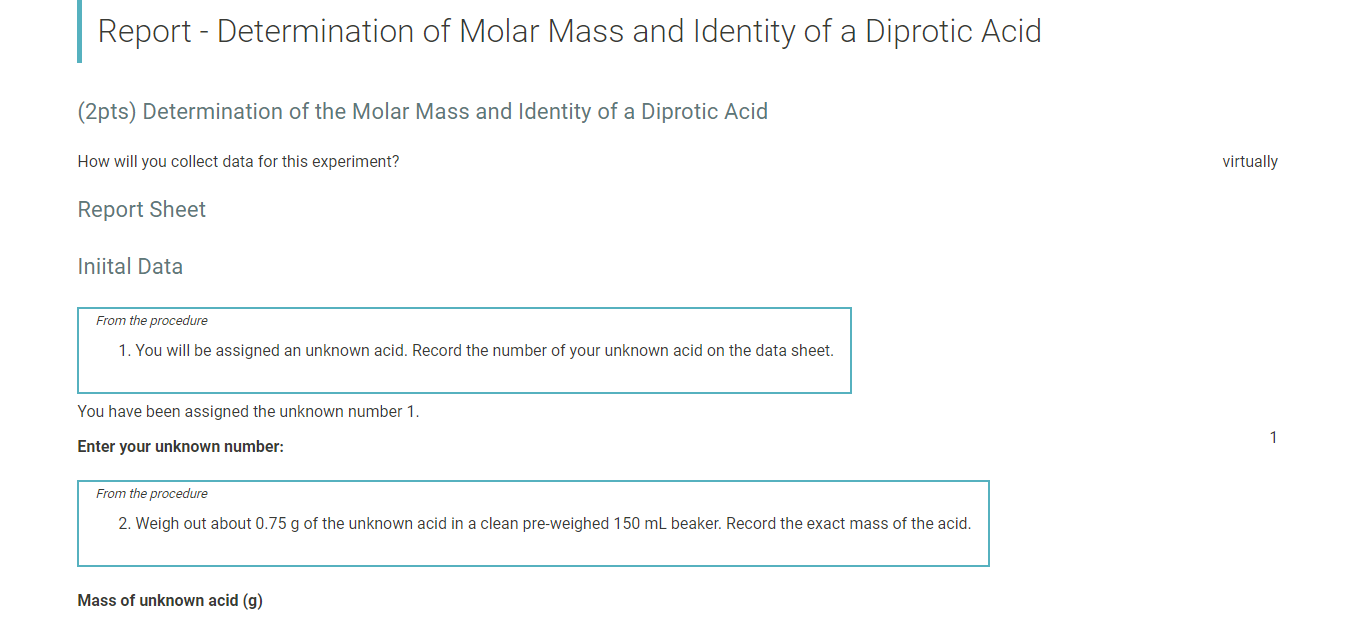
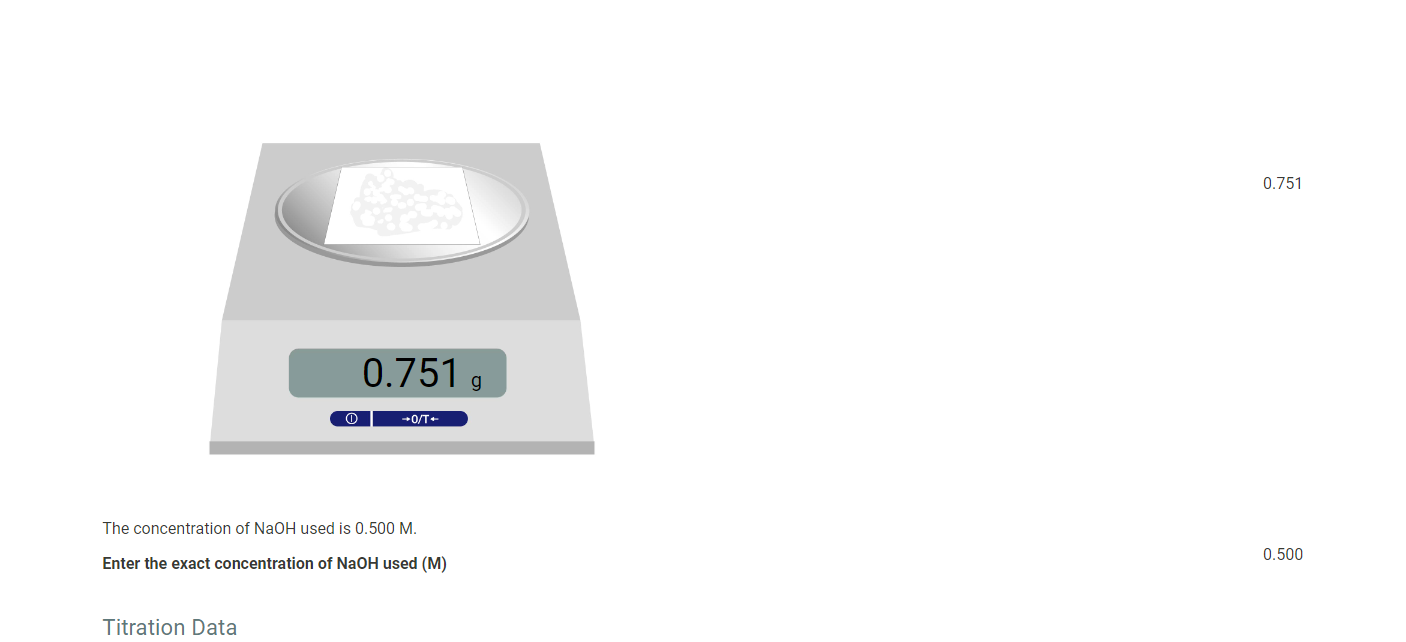
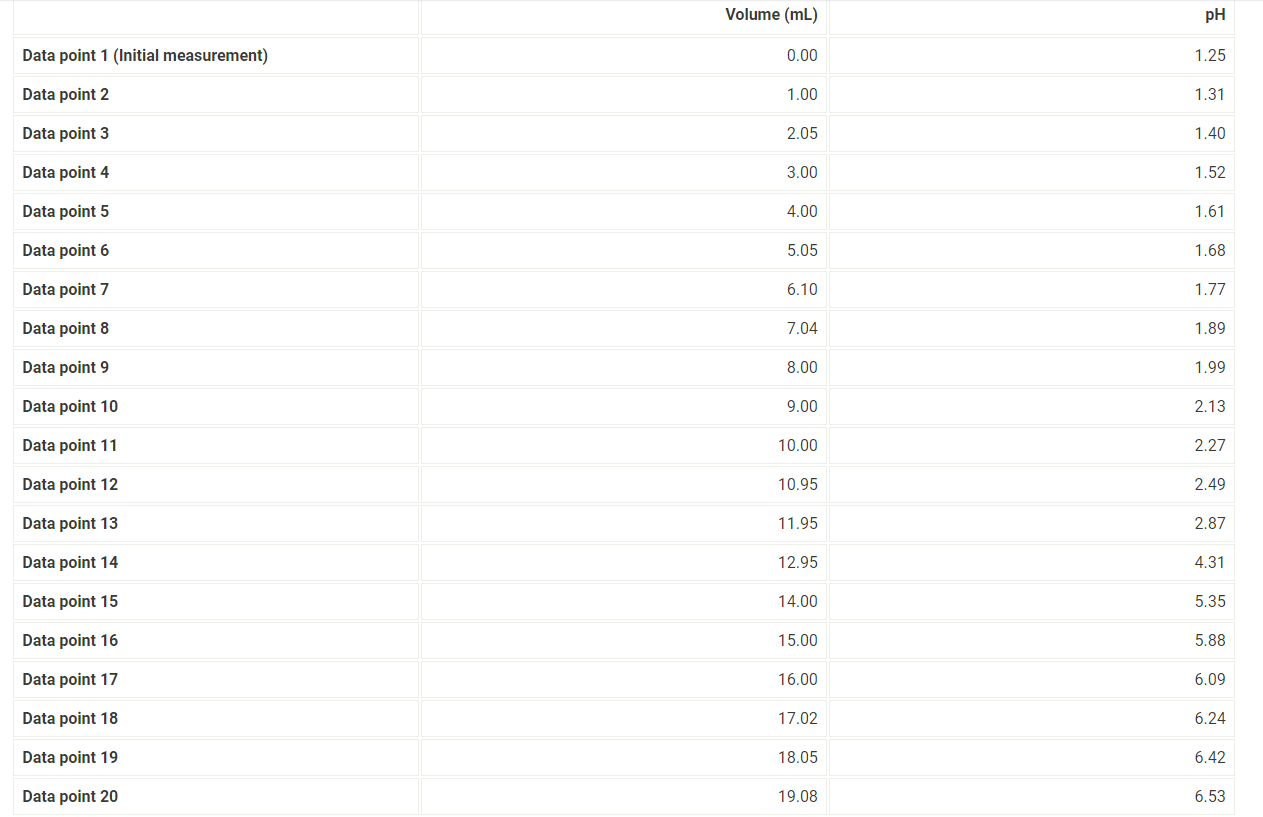
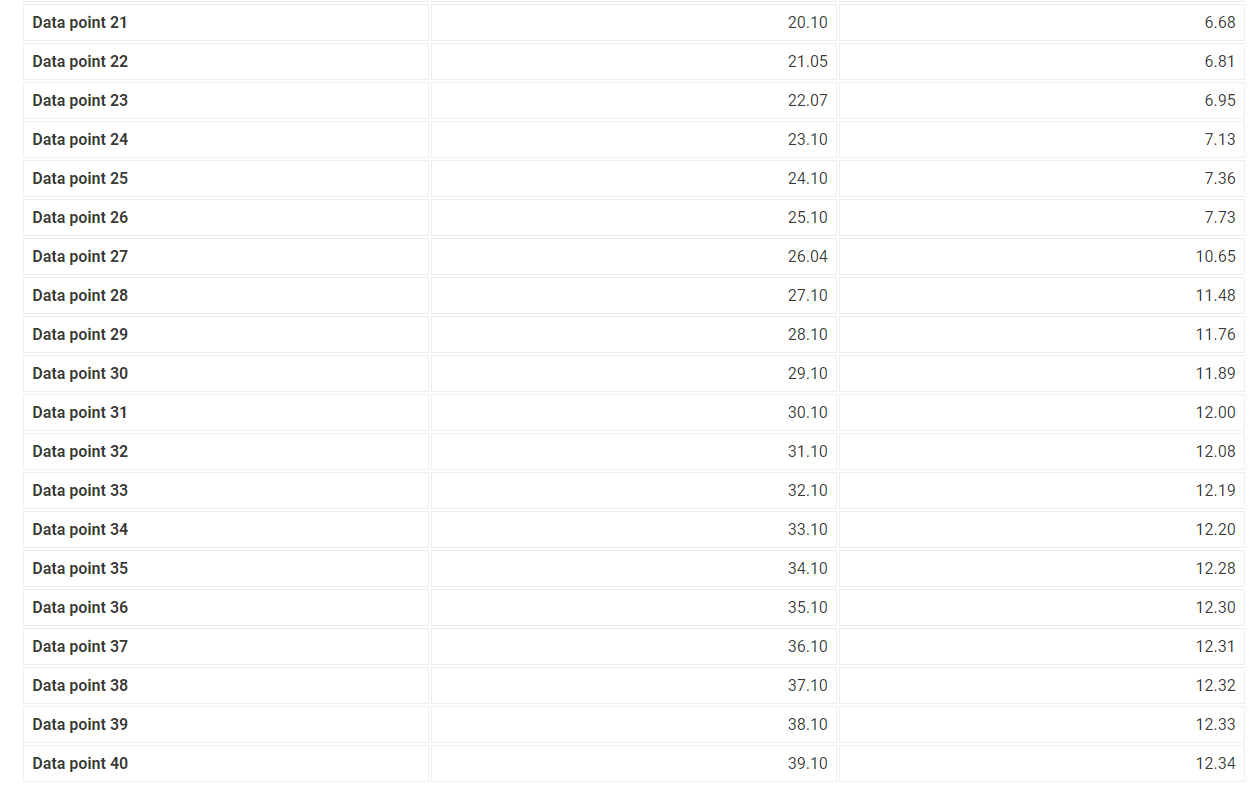
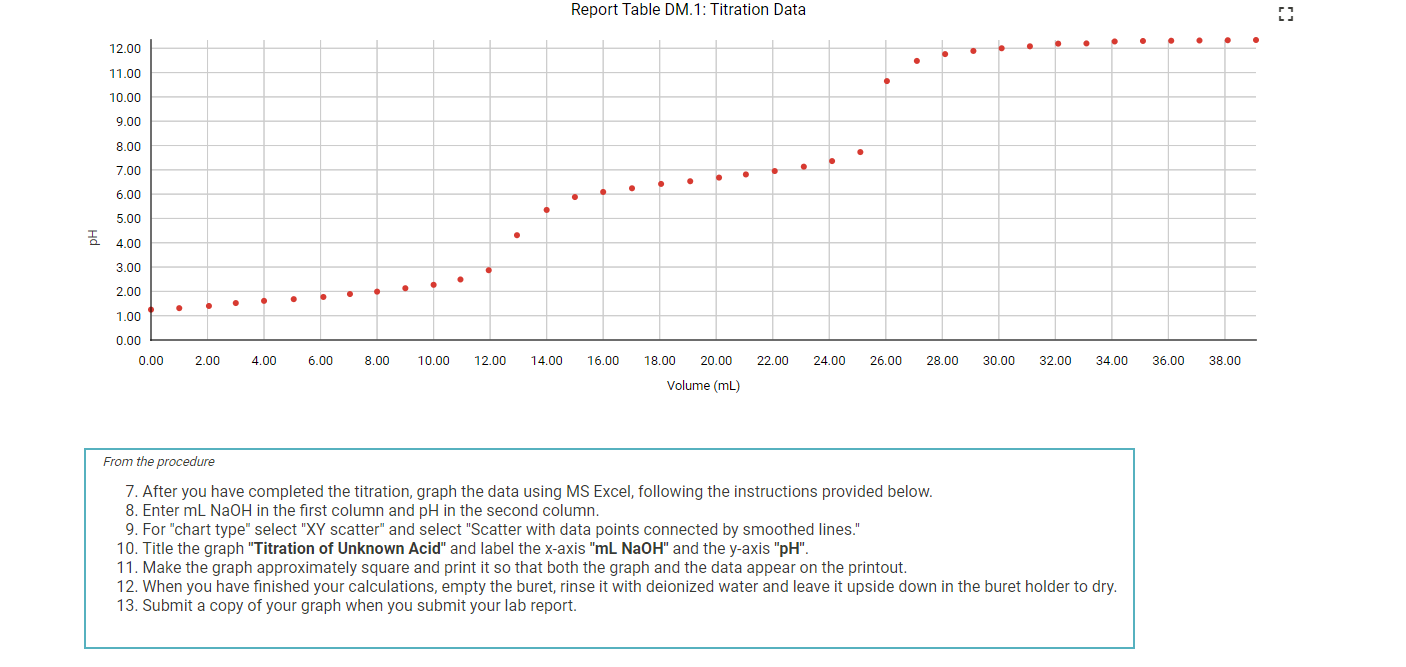
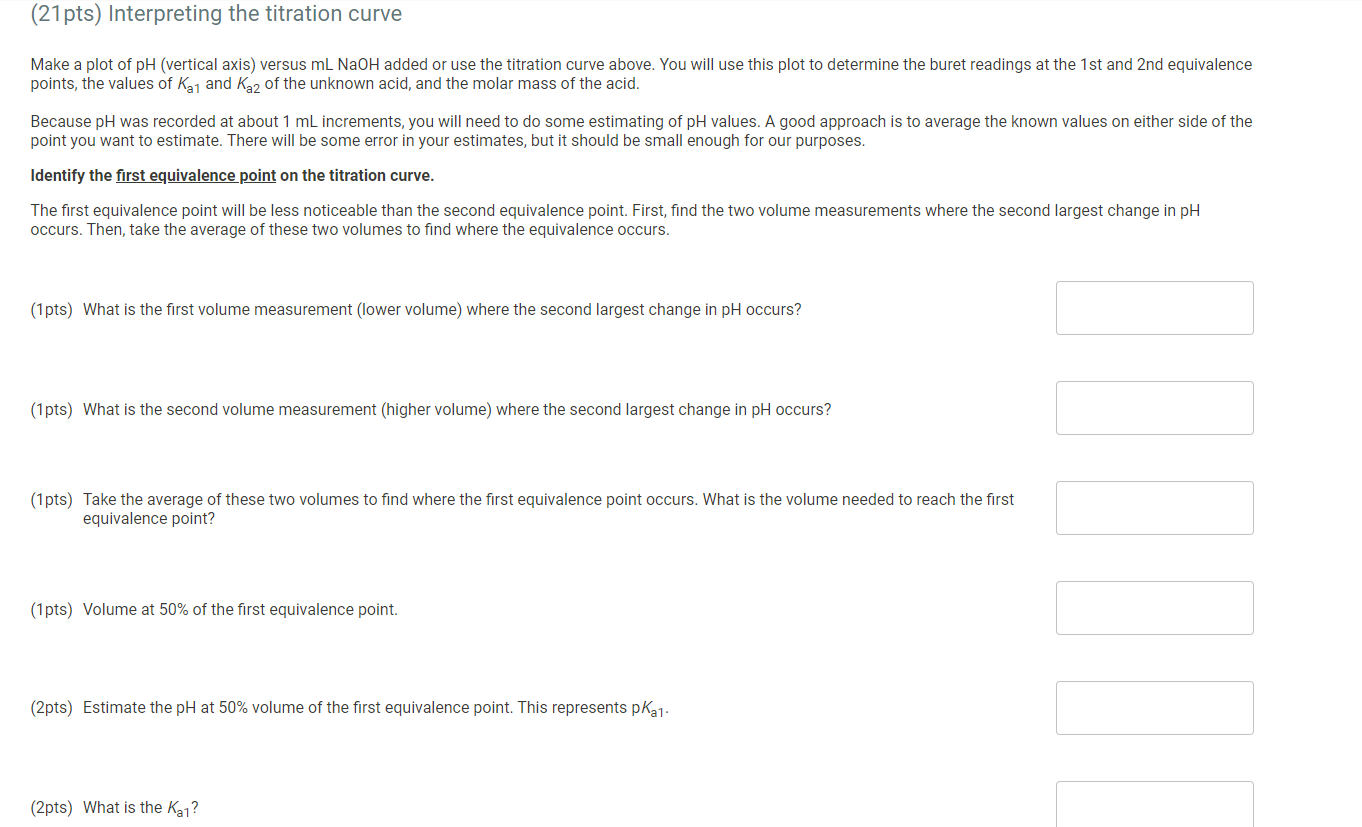

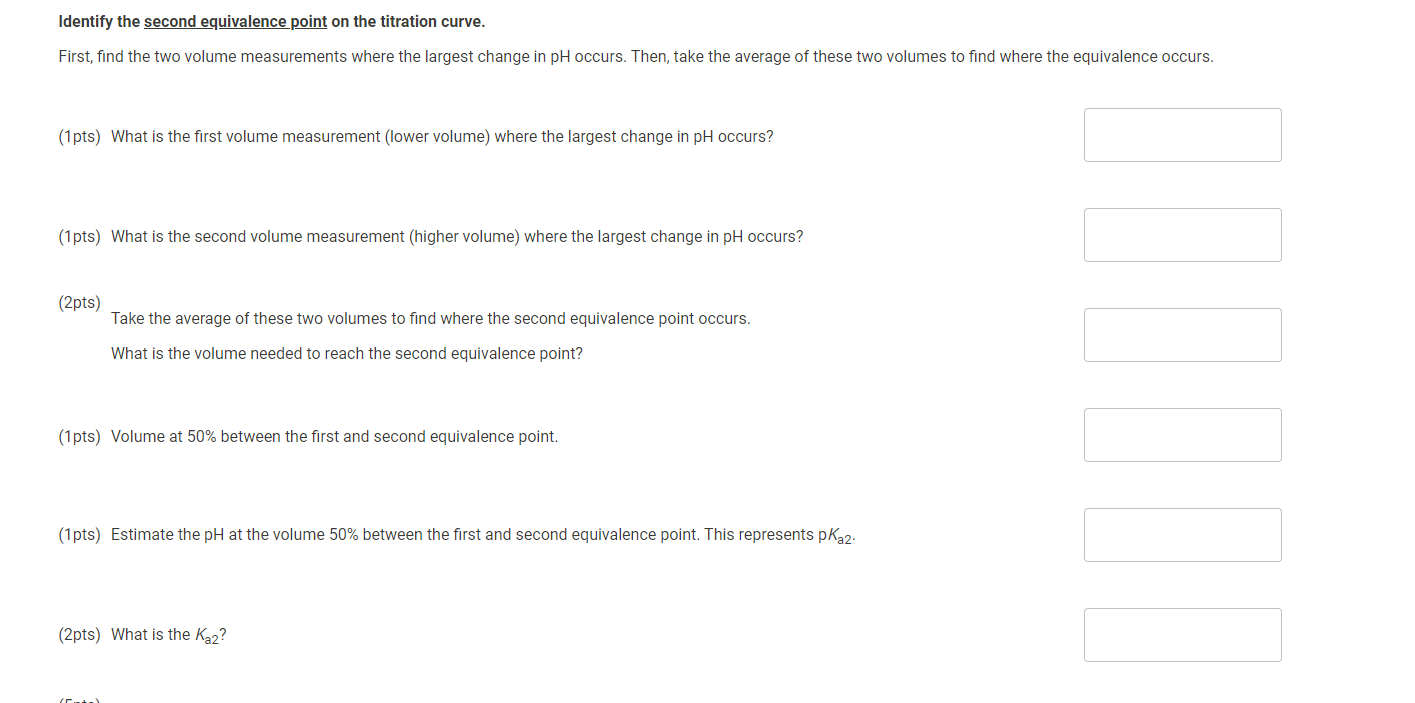
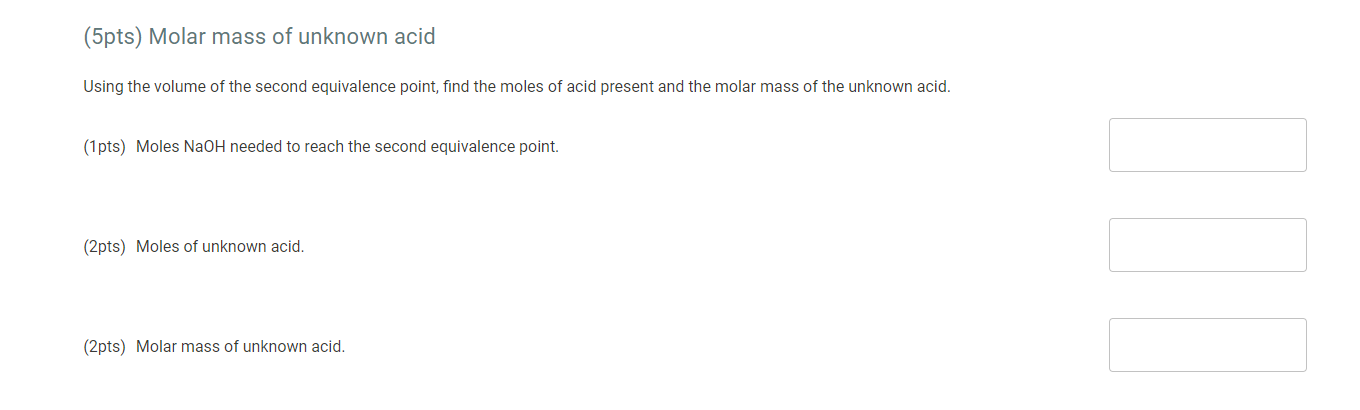
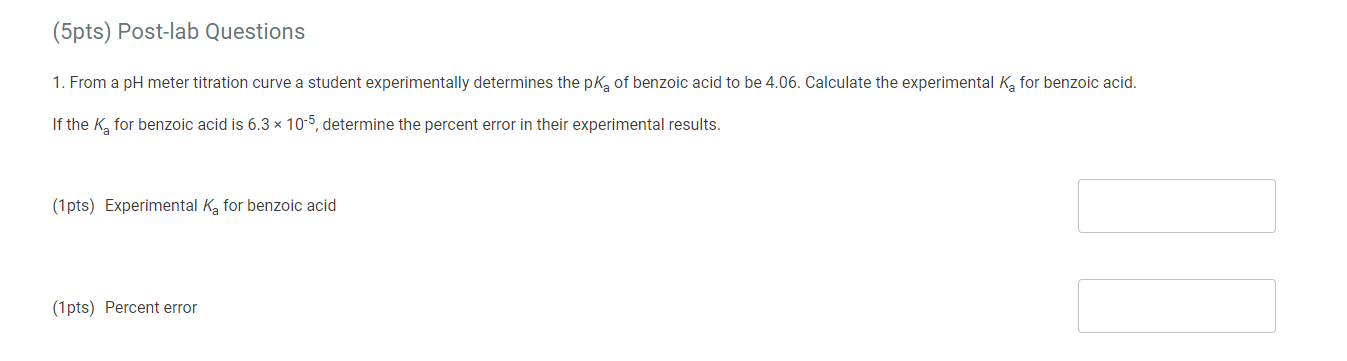
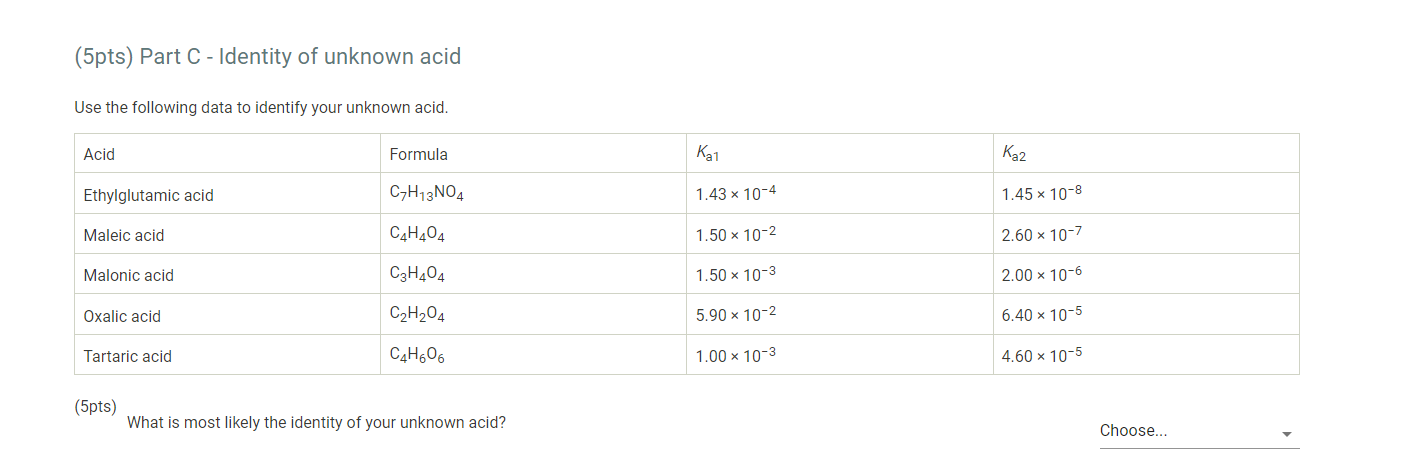
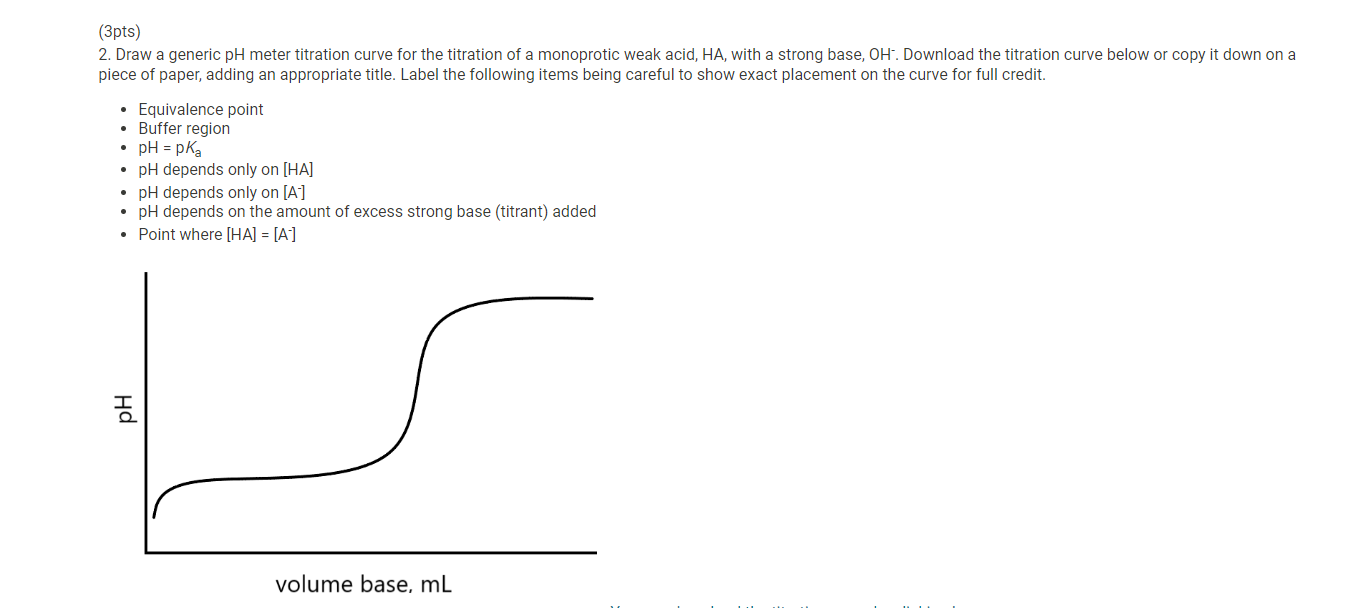
7. After you have completed the titration, graph the data using MS Excel, following the instructions provided below. 8. Enter mLNaOH in the first column and pH in the second column. 9. For "chart type" select "XY scatter" and select "Scatter with data points connected by smoothed lines." 10. Title the graph "Titration of Unknown Acid" and label the x-axis "mL NaOH" and the y-axis "pH". 11. Make the graph approximately square and print it so that both the graph and the data appear on the printout. 12. When you have finished your calculations, empty the buret, rinse it with deionized water and leave it upside down in the buret holder to dry. 13. Submit a copy of your graph when you submit your lab report. Report - Determination of Molar Mass and Identity of a Diprotic Acid (2pts) Determination of the Molar Mass and Identity of a Diprotic Acid How will you collect data for this experiment? Report Sheet Iniital Data From the procedure 1. You will be assigned an unknown acid. Record the number of your unknown acid on the data sheet. You have been assigned the unknown number 1. Enter your unknown number: From the procedure 2. Weigh out about 0.75g of the unknown acid in a clean pre-weighed 150mL beaker. Record the exact mass of the acid. Mass of unknown acid (g) The concentration of NaOH used is 0.500M. Enter the exact concentration of NaOH used (M) Titration Data Data point 21 Data point 22 Data point 23 Data point 24 Data point 25 Data point 26 Data point 27 Data point 28 Data point 29 Data point 30 Data point 31 Data point 32 Data point 33 Data point 34 Data point 35 Data point 36 Data point 37 Data point 38 Data point 39 Data point 40 7. After you have completed the titration, graph the data using MS Excel, following the instructions provided below. 8. Enter mLNaOH in the first column and pH in the second column. 9. For "chart type" select "XY scatter" and select "Scatter with data points connected by smoothed lines." 10. Title the graph "Titration of Unknown Acid" and label the x-axis "mL NaOH" and the y-axis "pH". 11. Make the graph approximately square and print it so that both the graph and the data appear on the printout. 12. When you have finished your calculations, empty the buret, rinse it with deionized water and leave it upside down in the buret holder to dry. 13. Submit a copy of your graph when you submit your lab report. Make a plot of pH (vertical axis) versus mLNaOH added or use the titration curve above. You will use this plot to determine the buret readings at the 1 st and 2nd equivalence points, the values of Ka1 and Ka2 of the unknown acid, and the molar mass of the acid. Because pH was recorded at about 1mL increments, you will need to do some estimating of pH values. A good approach is to average the known values on either side of the point you want to estimate. There will be some error in your estimates, but it should be small enough for our purposes. Identify the first equivalence point on the titration curve. The first equivalence point will be less noticeable than the second equivalence point. First, find the two volume measurements where the second largest change in pH occurs. Then, take the average of these two volumes to find where the equivalence occurs. (1pts) What is the first volume measurement (lower volume) where the second largest change in pH occurs? (1pts) What is the second volume measurement (higher volume) where the second largest change in pH occurs? (1pts) Take the average of these two volumes to find where the first equivalence point occurs. What is the volume needed to reach the first equivalence point? (1pts) Volume at 50% of the first equivalence point. (2pts) Estimate the pH at 50% volume of the first equivalence point. This represents pKa1. (2pts) What is the Ka1 ? Make a plot of pH (vertical axis) versus mLNaOH added or use the titration curve above. You will use this plot to determine the buret readings at the 1 st and 2nd equivalence points, the values of Ka1 and Ka2 of the unknown acid, and the molar mass of the acid. Because pH was recorded at about 1mL increments, you will need to do some estimating of pH values. A good approach is to average the known values on either side of the point you want to estimate. There will be some error in your estimates, but it should be small enough for our purposes. Identify the first equivalence point on the titration curve. The first equivalence point will be less noticeable than the second equivalence point. First, find the two volume measurements where the second largest change in pH occurs. Then, take the average of these two volumes to find where the equivalence occurs. (1pts) What is the first volume measurement (lower volume) where the second largest change in pH occurs? (1pts) What is the second volume measurement (higher volume) where the second largest change in pH occurs? (1pts) Take the average of these two volumes to find where the first equivalence point occurs. What is the volume needed to reach the first equivalence point? (1pts) Volume at 50% of the first equivalence point. (2pts) Estimate the pH at 50% volume of the first equivalence point. This represents pKa1. (2pts) What is the Ka1 ? Identify the second equivalence point on the titration curve. First, find the two volume measurements where the largest change in pH occurs. Then, take the average of these two volumes to find where the equivalence occurs. (1pts) What is the first volume measurement (lower volume) where the largest change in pH occurs? (1pts) What is the second volume measurement (higher volume) where the largest change in pH occurs? (2pts) Take the average of these two volumes to find where the second equivalence point occurs. What is the volume needed to reach the second equivalence point? (1pts) Volume at 50% between the first and second equivalence point. (1pts) Estimate the pH at the volume 50% between the first and second equivalence point. This represents pKa2. (2pts) What is the Ka2 ? (5pts) Molar mass of unknown acid Using the volume of the second equivalence point, find the moles of acid present and the molar mass of the unknown acid. (1pts) Moles NaOH needed to reach the second equivalence point. (2pts) Moles of unknown acid. (2pts) Molar mass of unknown acid. (5pts) Post-lab Questions 1. From a pH meter titration curve a student experimentally determines the pKa of benzoic acid to be 4.06. Calculate the experimental Ka for benzoic acid. If the Ka for benzoic acid is 6.3105, determine the percent error in their experimental results. (1pts) Experimental Ka for benzoic acid (1pts) Percent error (5pts) Part C - Identity of unknown acid Use the following data to identify your unknown acid. (5pts) What is most likely the identity of your unknown acid? (3pts) 2. Draw a generic pH meter titration curve for the titration of a monoprotic weak acid, HA, with a strong base, OH. Download the titration curve below or copy it down on a piece of paper, adding an appropriate title. Label the following items being careful to show exact placement on the curve for full credit. - Equivalence point - Buffer region - pH=pKa - pH depends only on [HA] - pH depends only on [A] - pH depends on the amount of excess strong base (titrant) added - Point where [HA]=[A] (1pts) For full credit, upload your work for the calculation of Ka1,Ka2, and the molar mass of your unknown acid, including all units. 7. After you have completed the titration, graph the data using MS Excel, following the instructions provided below. 8. Enter mLNaOH in the first column and pH in the second column. 9. For "chart type" select "XY scatter" and select "Scatter with data points connected by smoothed lines." 10. Title the graph "Titration of Unknown Acid" and label the x-axis "mL NaOH" and the y-axis "pH". 11. Make the graph approximately square and print it so that both the graph and the data appear on the printout. 12. When you have finished your calculations, empty the buret, rinse it with deionized water and leave it upside down in the buret holder to dry. 13. Submit a copy of your graph when you submit your lab report. Report - Determination of Molar Mass and Identity of a Diprotic Acid (2pts) Determination of the Molar Mass and Identity of a Diprotic Acid How will you collect data for this experiment? Report Sheet Iniital Data From the procedure 1. You will be assigned an unknown acid. Record the number of your unknown acid on the data sheet. You have been assigned the unknown number 1. Enter your unknown number: From the procedure 2. Weigh out about 0.75g of the unknown acid in a clean pre-weighed 150mL beaker. Record the exact mass of the acid. Mass of unknown acid (g) The concentration of NaOH used is 0.500M. Enter the exact concentration of NaOH used (M) Titration Data Data point 21 Data point 22 Data point 23 Data point 24 Data point 25 Data point 26 Data point 27 Data point 28 Data point 29 Data point 30 Data point 31 Data point 32 Data point 33 Data point 34 Data point 35 Data point 36 Data point 37 Data point 38 Data point 39 Data point 40 7. After you have completed the titration, graph the data using MS Excel, following the instructions provided below. 8. Enter mLNaOH in the first column and pH in the second column. 9. For "chart type" select "XY scatter" and select "Scatter with data points connected by smoothed lines." 10. Title the graph "Titration of Unknown Acid" and label the x-axis "mL NaOH" and the y-axis "pH". 11. Make the graph approximately square and print it so that both the graph and the data appear on the printout. 12. When you have finished your calculations, empty the buret, rinse it with deionized water and leave it upside down in the buret holder to dry. 13. Submit a copy of your graph when you submit your lab report. Make a plot of pH (vertical axis) versus mLNaOH added or use the titration curve above. You will use this plot to determine the buret readings at the 1 st and 2nd equivalence points, the values of Ka1 and Ka2 of the unknown acid, and the molar mass of the acid. Because pH was recorded at about 1mL increments, you will need to do some estimating of pH values. A good approach is to average the known values on either side of the point you want to estimate. There will be some error in your estimates, but it should be small enough for our purposes. Identify the first equivalence point on the titration curve. The first equivalence point will be less noticeable than the second equivalence point. First, find the two volume measurements where the second largest change in pH occurs. Then, take the average of these two volumes to find where the equivalence occurs. (1pts) What is the first volume measurement (lower volume) where the second largest change in pH occurs? (1pts) What is the second volume measurement (higher volume) where the second largest change in pH occurs? (1pts) Take the average of these two volumes to find where the first equivalence point occurs. What is the volume needed to reach the first equivalence point? (1pts) Volume at 50% of the first equivalence point. (2pts) Estimate the pH at 50% volume of the first equivalence point. This represents pKa1. (2pts) What is the Ka1 ? Make a plot of pH (vertical axis) versus mLNaOH added or use the titration curve above. You will use this plot to determine the buret readings at the 1 st and 2nd equivalence points, the values of Ka1 and Ka2 of the unknown acid, and the molar mass of the acid. Because pH was recorded at about 1mL increments, you will need to do some estimating of pH values. A good approach is to average the known values on either side of the point you want to estimate. There will be some error in your estimates, but it should be small enough for our purposes. Identify the first equivalence point on the titration curve. The first equivalence point will be less noticeable than the second equivalence point. First, find the two volume measurements where the second largest change in pH occurs. Then, take the average of these two volumes to find where the equivalence occurs. (1pts) What is the first volume measurement (lower volume) where the second largest change in pH occurs? (1pts) What is the second volume measurement (higher volume) where the second largest change in pH occurs? (1pts) Take the average of these two volumes to find where the first equivalence point occurs. What is the volume needed to reach the first equivalence point? (1pts) Volume at 50% of the first equivalence point. (2pts) Estimate the pH at 50% volume of the first equivalence point. This represents pKa1. (2pts) What is the Ka1 ? Identify the second equivalence point on the titration curve. First, find the two volume measurements where the largest change in pH occurs. Then, take the average of these two volumes to find where the equivalence occurs. (1pts) What is the first volume measurement (lower volume) where the largest change in pH occurs? (1pts) What is the second volume measurement (higher volume) where the largest change in pH occurs? (2pts) Take the average of these two volumes to find where the second equivalence point occurs. What is the volume needed to reach the second equivalence point? (1pts) Volume at 50% between the first and second equivalence point. (1pts) Estimate the pH at the volume 50% between the first and second equivalence point. This represents pKa2. (2pts) What is the Ka2 ? (5pts) Molar mass of unknown acid Using the volume of the second equivalence point, find the moles of acid present and the molar mass of the unknown acid. (1pts) Moles NaOH needed to reach the second equivalence point. (2pts) Moles of unknown acid. (2pts) Molar mass of unknown acid. (5pts) Post-lab Questions 1. From a pH meter titration curve a student experimentally determines the pKa of benzoic acid to be 4.06. Calculate the experimental Ka for benzoic acid. If the Ka for benzoic acid is 6.3105, determine the percent error in their experimental results. (1pts) Experimental Ka for benzoic acid (1pts) Percent error (5pts) Part C - Identity of unknown acid Use the following data to identify your unknown acid. (5pts) What is most likely the identity of your unknown acid? (3pts) 2. Draw a generic pH meter titration curve for the titration of a monoprotic weak acid, HA, with a strong base, OH. Download the titration curve below or copy it down on a piece of paper, adding an appropriate title. Label the following items being careful to show exact placement on the curve for full credit. - Equivalence point - Buffer region - pH=pKa - pH depends only on [HA] - pH depends only on [A] - pH depends on the amount of excess strong base (titrant) added - Point where [HA]=[A] (1pts) For full credit, upload your work for the calculation of Ka1,Ka2, and the molar mass of your unknown acid, including all units
Step by Step Solution
There are 3 Steps involved in it

Get step-by-step solutions from verified subject matter experts