

Question: 7. Analyzing Graphics. For each of the graphics below, write a brief explanation to support it. a) Projected vs. Actual Profits, 2017-2020 Millions of
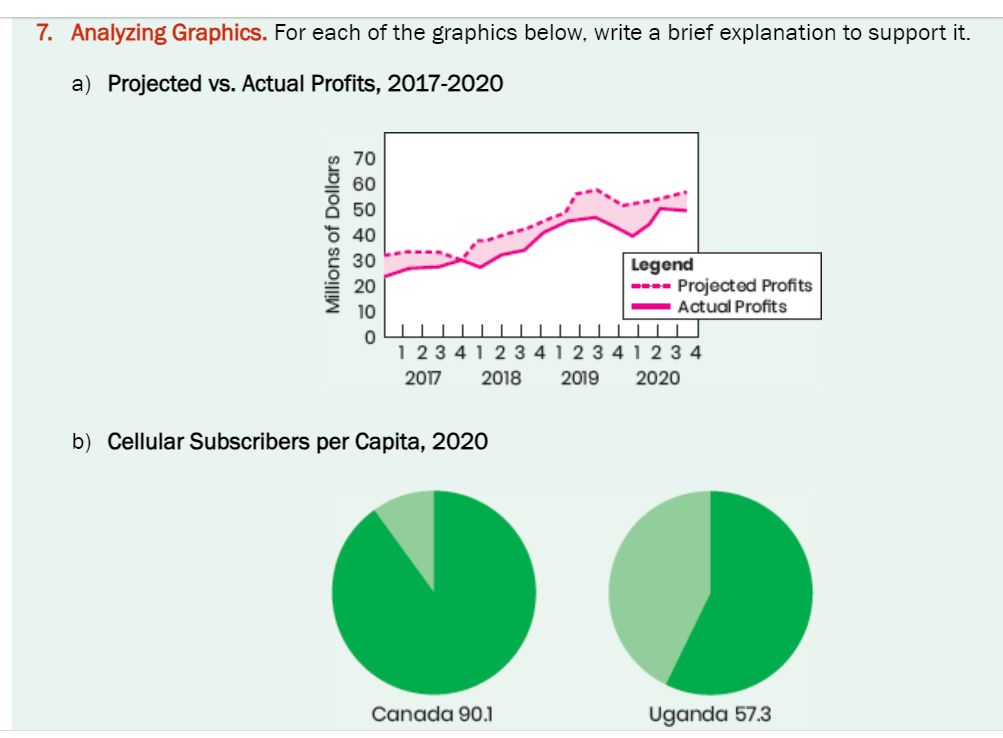
7. Analyzing Graphics. For each of the graphics below, write a brief explanation to support it. a) Projected vs. Actual Profits, 2017-2020 Millions of Dollars 70 60 50 40 30 20 10 Legend Projected Profits - Actual Profits 1 2 3 4 1 2 3 4 1 2 3 4 1234 2017 b) Cellular Subscribers per Capita, 2020 2018 2019 2020 Canada 90.1 Uganda 57.3
Step by Step Solution
There are 3 Steps involved in it
1 Expert Approved Answer
Step: 1 Unlock

a Projected vs Actual Profits 20172020 As can be seen from this chart the dotted line reflects expec... View full answer
Question Has Been Solved by an Expert!
Get step-by-step solutions from verified subject matter experts
Step: 2 Unlock
Step: 3 Unlock