

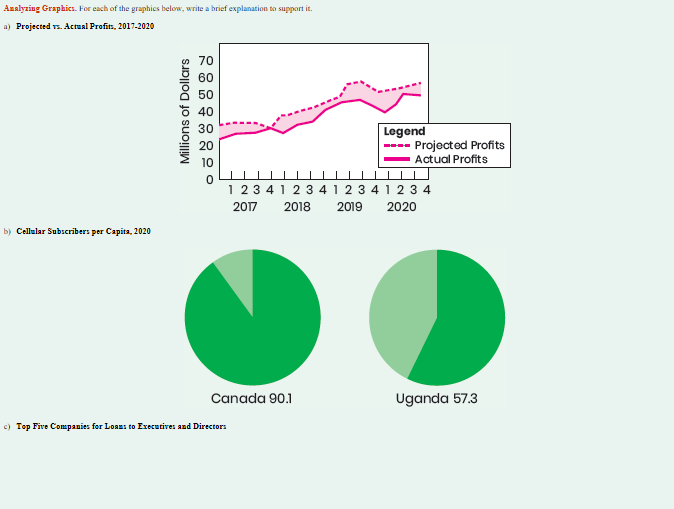
Question: Analyzing Graphics. For each of the graphics below, write a brief explanation to support it. a) Projected vs. Actual Profits, 2017-2020 Millions of Dollars 70

Step by Step Solution
There are 3 Steps involved in it
1 Expert Approved Answer
Step: 1 Unlock

Question Has Been Solved by an Expert!
Get step-by-step solutions from verified subject matter experts
Step: 2 Unlock
Step: 3 Unlock