

Question: 7. Based on the table and graph above, what would be the Sharpe Ration of Portfolio B? A. same as for portfolio C B. average
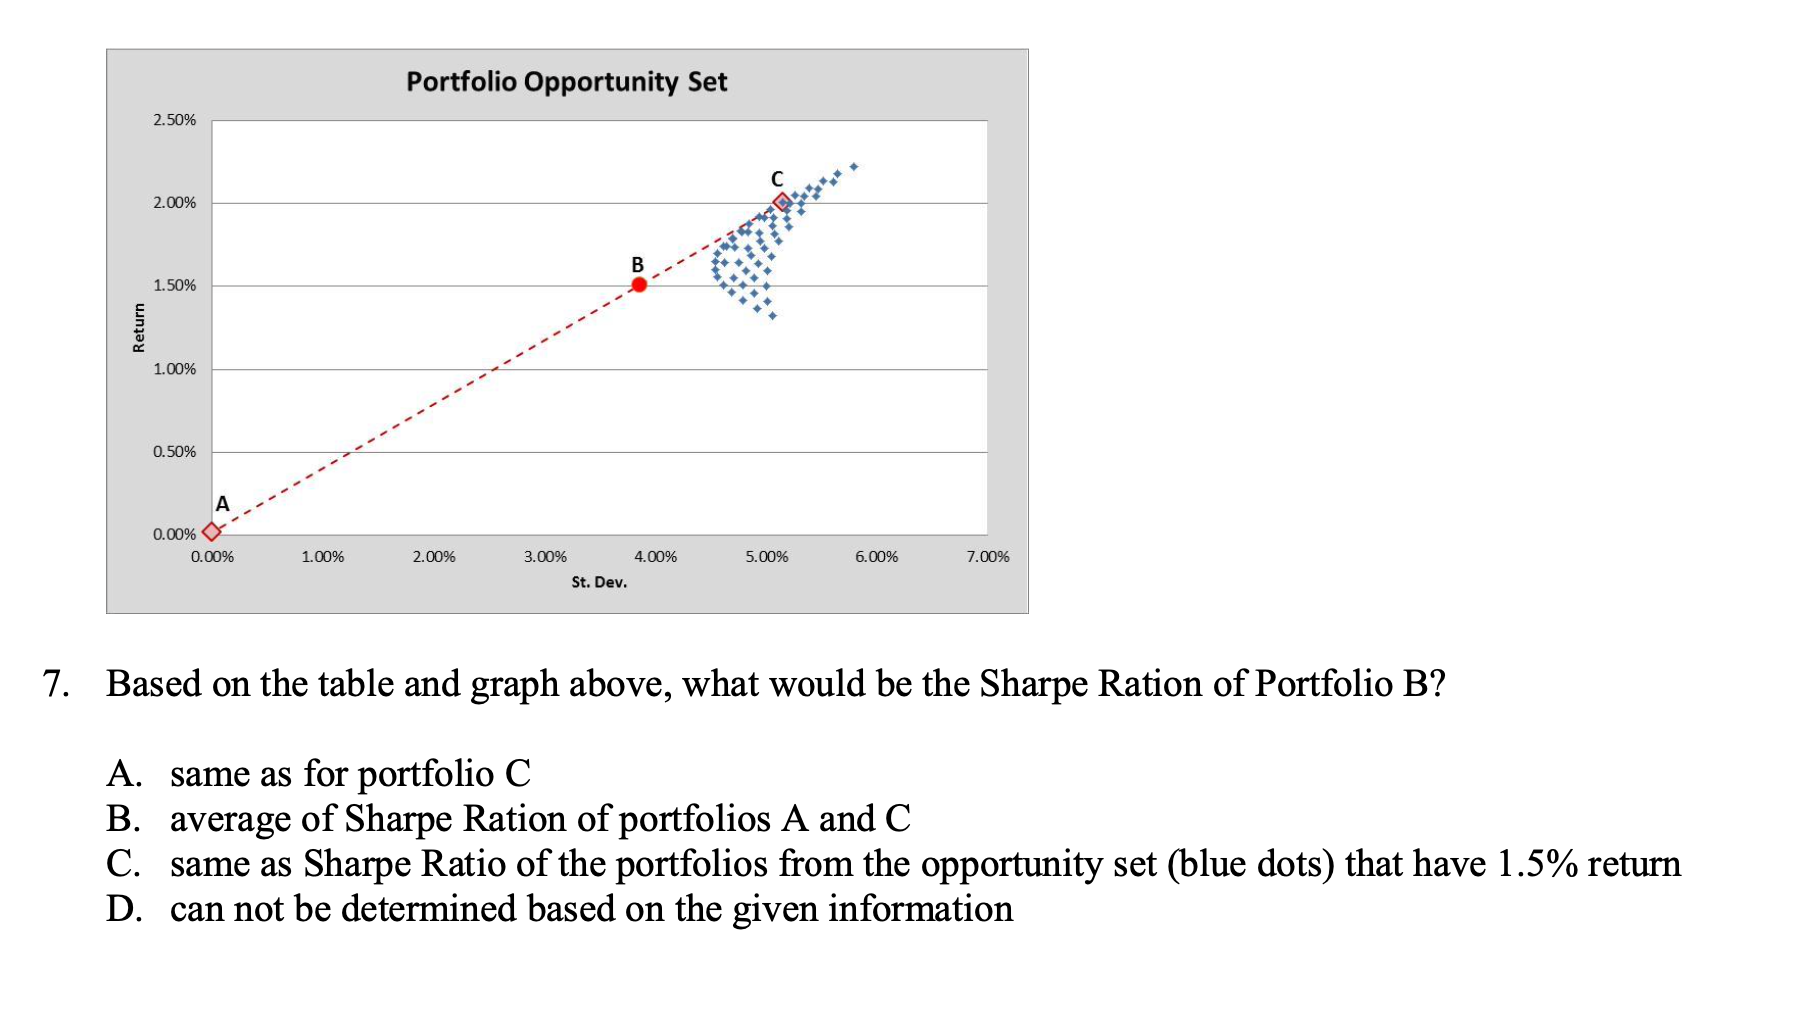
7. Based on the table and graph above, what would be the Sharpe Ration of Portfolio B? A. same as for portfolio C B. average of Sharpe Ration of portfolios A and C C. same as Sharpe Ratio of the portfolios from the opportunity set (blue dots) that have 1.5% return D. can not be determined based on the given information
Step by Step Solution
There are 3 Steps involved in it
1 Expert Approved Answer
Step: 1 Unlock

Question Has Been Solved by an Expert!
Get step-by-step solutions from verified subject matter experts
Step: 2 Unlock
Step: 3 Unlock