Question: 7. Comparing one- and two-way ANOVA Aa Aa Dr. Diane Gold and her colleagues study how rotating shift work (switching back and forth between the
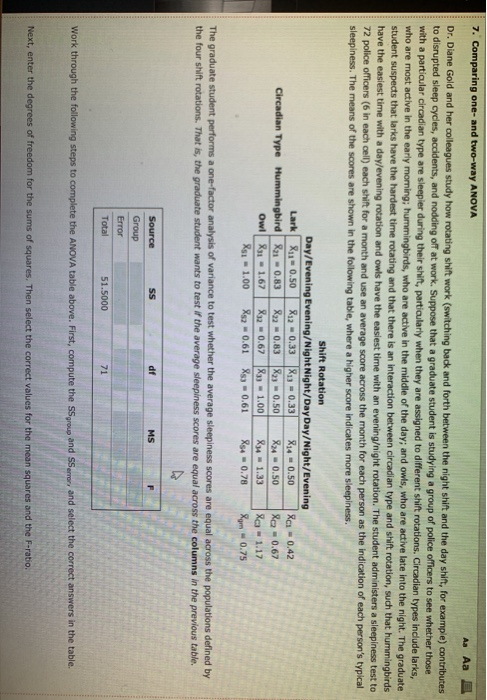
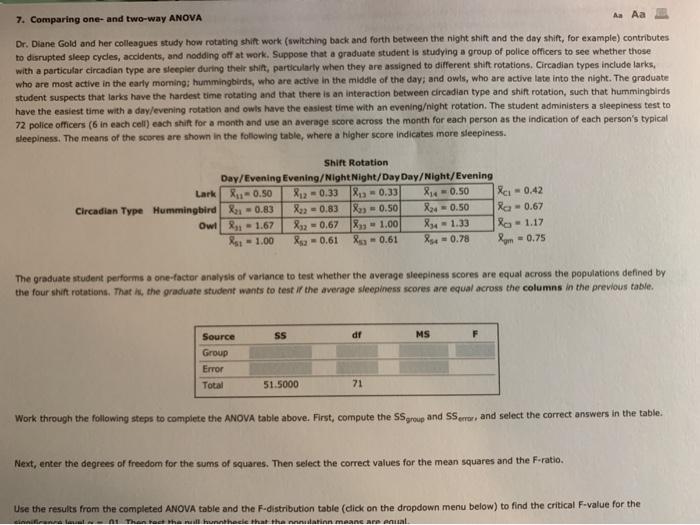
7. Comparing one- and two-way ANOVA Aa Aa Dr. Diane Gold and her colleagues study how rotating shift work (switching back and forth between the night shift and the day shift, for example) contributes to disrupted sleep cycles, accidents, and nodding off at work. Suppose that a graduate student is studying a group of police officers to see whether those with a particular circadian type are sleepier during their shift, particularly when they are assigned to different shift rotations. Circadian types include tarks, who are most active in the early morning; hummingbirds, who are active in the middle of the day, and owls, who are active late into the night. The graduate student suspects that larks have the hardest time rotating and that there is an interaction between circadian type and shift rotation, such that hummingbirds have the easiest time with a day evening rotation and owls have the easiest time with an eveningight rotation. The student administers a sleepiness test to 72 police officers (6 in each cell) each shift for a month and use an average score across the month for each person as the indication of each person's typical sleepiness. The means of the scores are shown in the following table, where a higher score indicates more sleepiness. Shift Rotation Day/Evening Evening/Night Night/Day Day/Night/Evening Lark X11-0.50 X120.33 X) = 0.33 X14 - 0.50 SCI 0,42 Circadian Type Hummingbird 81 - 0.83 822 0.83 X23 -0.50 X24 - 0.50 R = 0.67 Owl X - 1.67 X32 -0.67 893 - 1.00 R34 1.33 8a - 1.17 As - 1.00 Xs2 -0.61 Xs) - 0.61 Xs40.78 Rom - 0.75 The graduate student performs a one-factor analysis of variance to test whether the average sleepiness scores are equal across the populations defined by the four shift rotations. That is, the graduate student wants to test if the average sleepiness scores are equal across the columns in the previous table. SS df MS F Source Group Error Total 51.5000 71 Work through the following steps to complete the ANOVA table above. First, compute the SS group and Server, and select the correct answers in the table. Next, enter the degrees of freedom for the sums of squares. Then select the correct values for the mean squares and the F-ratio. 7. Comparing one- and two-way ANOVA Aa Aa Dr. Diane Gold and her colleagues study how rotating shift work (switching back and forth between the night shift and the day shift, for example) contributes to disrupted sleep cycles, accidents, and nodding off at work. Suppose that a graduate student is studying a group of police officers to see whether those with a particular circadian type are sleepier during their shift, particularly when they are assigned to different shift rotations. Circadian types include larks, who are most active in the early morning: hummingbirds, who are active in the middle of the day, and owls, who are active late into the night. The graduate student suspects that larks have the hardest time rotating and that there is an interaction between circadian type and shift rotation, such that hummingbirds have the easiest time with a day/evening rotation and owls have the easiest time with an eveningight rotation. The student administers a sleepiness test to 72 police officers (6 in each cell) each shift for a month and use an average score across the month for each person as the indication of each person's typical sleepiness. The means of the scores are shown in the following table, where a higher score indicates more sleepiness. Shift Rotation Day/Evening Evening/Night Night/Day Day/Night/Evening Lark Ru-0.50 812 - 0.33 % - 0.33 814 - 0.50 | 81 - 0.42 Circadian Type Hummingbird X1 -0.83 R22 - 0.83 ) - 0.50 X4 - 0.50 Rc-0.67 Owl 21 - 1.67 832 -0.67 X - 1.00 X4 - 1.33 lo - 1.17 Rs1 - 1.00 Rs2 -0.61 Xs - 0.61 254 = 0.78 Ron = 0.75 The graduate student performs a one-factor analysis of variance to test whether the average sleepiness scores are equal across the populations defined by the four shift rotations. That is, the graduate student wants to test if the average sleepiness scores are equal across the columns in the previous table. SS df MS F Source Group Error Total 51.5000 71 Work through the following steps to complete the ANOVA table above. First, compute the SS group and SS errors and select the correct answers in the table. Next, enter the degrees of freedom for the sums of squares. Then select the correct values for the mean squares and the F-ratio. Use the results from the completed ANOVA table and the F-distribution table (click on the dropdown menu below) to find the critical F-value for the 1 Then tact the nuhunthecle that the natin means are anual 7. Comparing one- and two-way ANOVA Aa Aa Dr. Diane Gold and her colleagues study how rotating shift work (switching back and forth between the night shirt and the day shift, for example) contributes to disrupted sleep cycles, accidents, and nodding off at work. Suppose that a graduate student is studying a group of police officers to see whether those with a particular circadian type are sleepier during their shift, particularly when they are assigned to different shift rotations. Circadian types include larks, who are most active in the early morning: hummingbirds, who are active in the middle of the day; and owls, who are active late into the night. The graduate student suspects that larks have the hardest time rotating and that there is an interaction between circadian type and shift rotation, such that hummingbirds have the easiest time with a day/evening rotation and owls have the easiest time with an eveningight rotation. The student administers a sleepiness test to 72 police officers (6 in each cell) each shift for a month and use an average score across the month for each person as the indication of each person's typical sleepiness. The means of the scores are shown in the following table, where a higher score indicates more sleepiness. Shift Rotation Day/Evening Evening/Night Night/Day Day/Night/Evening Lark Ru-0.50 212 - 0.33 X - 0.33 814 - 0.50 &c - 0.42 Circadian Type Hummingbird X21-0.83 R22 - 0.83 R23 -0.50 R24 -0.50 Rc - 0.67 Owl 21 - 1.67 832 -0.67 X - 1.00 X4 - 1.33 lo - 1.17 Rs1 - 1.00 Xs2 -0.61 Xs - 0.61 254 = 0.78 Ron = 0.75 The graduate student performs a one-factor analysis of variance to test whether the average sleepiness scores are equal across the populations defined by the four shift rotations. That is, the graduate student wants to test if the average sleepiness scores are equal across the columns in the previous table. SS df MS F Source Group Error Total 51.5000 71 Work through the following steps to complete the ANOVA table above. First, compute the SS group and SS error, and select the correct answers in the table. Next, enter the degrees of freedom for the sums of squares. Then select the correct values for the mean squares and the F-ratio. Use the results from the completed ANOVA table and the F-distribution table (click on the dropdown menu below) to find the critical F-value for the 1 Thon tact the nuhunthecle that the natin means are equal 7. Comparing one- and two-way ANOVA Aa Aa Dr. Diane Gold and her colleagues study how rotating shift work (switching back and forth between the night shift and the day shift, for example) contributes to disrupted sleep cycles, accidents, and nodding off at work. Suppose that a graduate student is studying a group of police officers to see whether those with a particular circadian type are sleepier during their shift, particularly when they are assigned to different shift rotations. Circadian types include tarks, who are most active in the early morning; hummingbirds, who are active in the middle of the day, and owls, who are active late into the night. The graduate student suspects that larks have the hardest time rotating and that there is an interaction between circadian type and shift rotation, such that hummingbirds have the easiest time with a day evening rotation and owls have the easiest time with an eveningight rotation. The student administers a sleepiness test to 72 police officers (6 in each cell) each shift for a month and use an average score across the month for each person as the indication of each person's typical sleepiness. The means of the scores are shown in the following table, where a higher score indicates more sleepiness. Shift Rotation Day/Evening Evening/Night Night/Day Day/Night/Evening Lark X11-0.50 X120.33 X) = 0.33 X14 - 0.50 SCI 0,42 Circadian Type Hummingbird 81 - 0.83 822 0.83 X23 -0.50 X24 - 0.50 R = 0.67 Owl X - 1.67 X32 -0.67 893 - 1.00 R34 1.33 8a - 1.17 As - 1.00 Xs2 -0.61 Xs) - 0.61 Xs40.78 Rom - 0.75 The graduate student performs a one-factor analysis of variance to test whether the average sleepiness scores are equal across the populations defined by the four shift rotations. That is, the graduate student wants to test if the average sleepiness scores are equal across the columns in the previous table. SS df MS F Source Group Error Total 51.5000 71 Work through the following steps to complete the ANOVA table above. First, compute the SS group and Server, and select the correct answers in the table. Next, enter the degrees of freedom for the sums of squares. Then select the correct values for the mean squares and the F-ratio. 7. Comparing one- and two-way ANOVA Aa Aa Dr. Diane Gold and her colleagues study how rotating shift work (switching back and forth between the night shift and the day shift, for example) contributes to disrupted sleep cycles, accidents, and nodding off at work. Suppose that a graduate student is studying a group of police officers to see whether those with a particular circadian type are sleepier during their shift, particularly when they are assigned to different shift rotations. Circadian types include larks, who are most active in the early morning: hummingbirds, who are active in the middle of the day, and owls, who are active late into the night. The graduate student suspects that larks have the hardest time rotating and that there is an interaction between circadian type and shift rotation, such that hummingbirds have the easiest time with a day/evening rotation and owls have the easiest time with an eveningight rotation. The student administers a sleepiness test to 72 police officers (6 in each cell) each shift for a month and use an average score across the month for each person as the indication of each person's typical sleepiness. The means of the scores are shown in the following table, where a higher score indicates more sleepiness. Shift Rotation Day/Evening Evening/Night Night/Day Day/Night/Evening Lark Ru-0.50 812 - 0.33 % - 0.33 814 - 0.50 | 81 - 0.42 Circadian Type Hummingbird X1 -0.83 R22 - 0.83 ) - 0.50 X4 - 0.50 Rc-0.67 Owl 21 - 1.67 832 -0.67 X - 1.00 X4 - 1.33 lo - 1.17 Rs1 - 1.00 Rs2 -0.61 Xs - 0.61 254 = 0.78 Ron = 0.75 The graduate student performs a one-factor analysis of variance to test whether the average sleepiness scores are equal across the populations defined by the four shift rotations. That is, the graduate student wants to test if the average sleepiness scores are equal across the columns in the previous table. SS df MS F Source Group Error Total 51.5000 71 Work through the following steps to complete the ANOVA table above. First, compute the SS group and SS errors and select the correct answers in the table. Next, enter the degrees of freedom for the sums of squares. Then select the correct values for the mean squares and the F-ratio. Use the results from the completed ANOVA table and the F-distribution table (click on the dropdown menu below) to find the critical F-value for the 1 Then tact the nuhunthecle that the natin means are anual 7. Comparing one- and two-way ANOVA Aa Aa Dr. Diane Gold and her colleagues study how rotating shift work (switching back and forth between the night shirt and the day shift, for example) contributes to disrupted sleep cycles, accidents, and nodding off at work. Suppose that a graduate student is studying a group of police officers to see whether those with a particular circadian type are sleepier during their shift, particularly when they are assigned to different shift rotations. Circadian types include larks, who are most active in the early morning: hummingbirds, who are active in the middle of the day; and owls, who are active late into the night. The graduate student suspects that larks have the hardest time rotating and that there is an interaction between circadian type and shift rotation, such that hummingbirds have the easiest time with a day/evening rotation and owls have the easiest time with an eveningight rotation. The student administers a sleepiness test to 72 police officers (6 in each cell) each shift for a month and use an average score across the month for each person as the indication of each person's typical sleepiness. The means of the scores are shown in the following table, where a higher score indicates more sleepiness. Shift Rotation Day/Evening Evening/Night Night/Day Day/Night/Evening Lark Ru-0.50 212 - 0.33 X - 0.33 814 - 0.50 &c - 0.42 Circadian Type Hummingbird X21-0.83 R22 - 0.83 R23 -0.50 R24 -0.50 Rc - 0.67 Owl 21 - 1.67 832 -0.67 X - 1.00 X4 - 1.33 lo - 1.17 Rs1 - 1.00 Xs2 -0.61 Xs - 0.61 254 = 0.78 Ron = 0.75 The graduate student performs a one-factor analysis of variance to test whether the average sleepiness scores are equal across the populations defined by the four shift rotations. That is, the graduate student wants to test if the average sleepiness scores are equal across the columns in the previous table. SS df MS F Source Group Error Total 51.5000 71 Work through the following steps to complete the ANOVA table above. First, compute the SS group and SS error, and select the correct answers in the table. Next, enter the degrees of freedom for the sums of squares. Then select the correct values for the mean squares and the F-ratio. Use the results from the completed ANOVA table and the F-distribution table (click on the dropdown menu below) to find the critical F-value for the 1 Thon tact the nuhunthecle that the natin means are equal