

Question: 7. Diversification and risk The graph shows the relationship between risk, measured as the standard deviation of a stock portfolio's return, and the number of
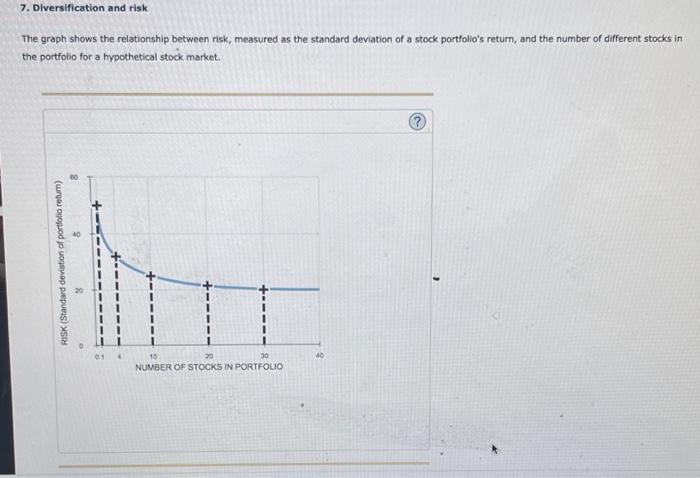
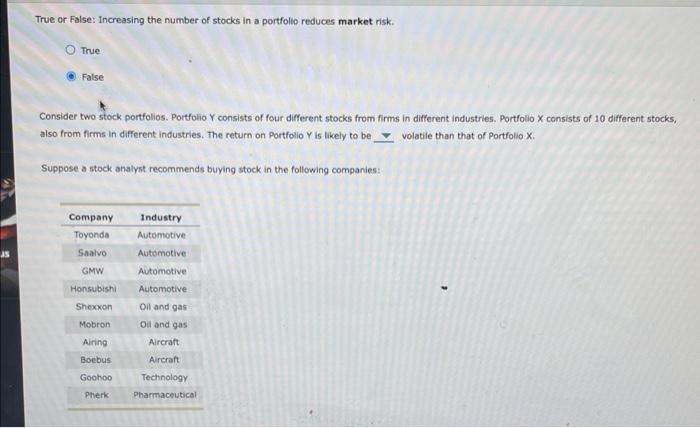
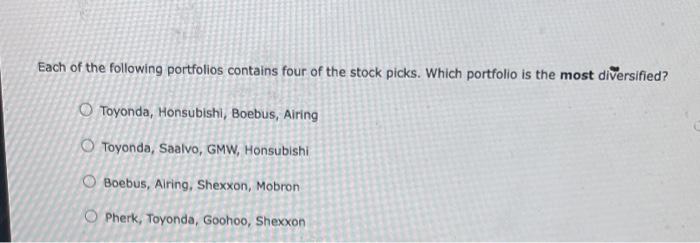
7. Diversification and risk The graph shows the relationship between risk, measured as the standard deviation of a stock portfolio's return, and the number of different stocks in the portfolio for a hypothetical stock market. RISK (Standard deviation of portfolio return) he 01 19 20 30 40 NUMBER OF STOCKS IN PORTFOLIO True or False: Increasing the number of stocks in a portfolio reduces market risk. True False Consider two stock portfolios Portfolio y consists of four different stocks from firms in different industries. Portfolio X consists of 10 different stocks, also from firms in different industries. The return on Portfolio Y is likely to be volatile than that of Portfolio X. Suppose a stock analyst recommends buying stock in the following companies Company Toyonda Saalvo Industry Automotive GMW Honsubishi Shexxon Automotive Automotive Automotive Oil and gas Oil and gas Aircraft Aircraft Mobron Airing Boebus Goohoo Technology Pharmaceutical Pherk Each of the following portfolios contains four of the stock picks. Which portfolio is the most diversified? Toyonda, Honsubishi, Boebus, Airing Toyonda, Saalvo, GMW, Honsubishi O Boebus, Alring, Shexxon, Mobron O Pherk, Toyonda, Goohoo, Shexxon
Step by Step Solution
There are 3 Steps involved in it

Get step-by-step solutions from verified subject matter experts