

Question: The following graph plots the relationship between risk, calculated as the standard deviation of the return of a stock portfolio, and the number of different
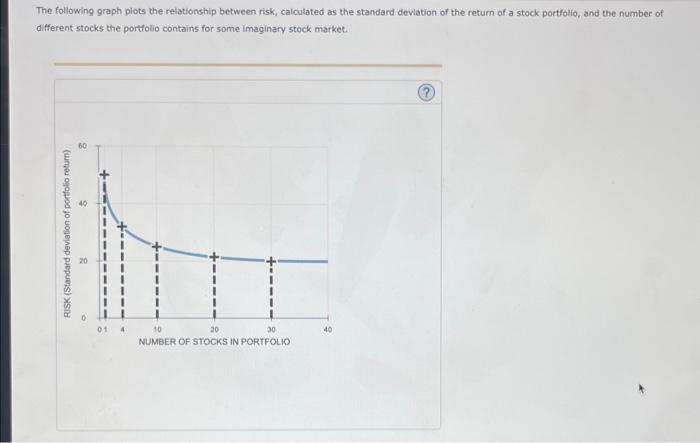


The following graph plots the relationship between risk, calculated as the standard deviation of the return of a stock portfolio, and the number of different stocks the portfolio contains for some imaginary stock market. True or false: increasing the number of stocks in a portfolio reduces market risk. True False Consider two stock portfolios. Portfolio B consists of 20 different stocks from firms in different industries. Portfolio A consists of 10 different stocks, also from firms in ditferent industries. The return on Portfolio B is likely to be volatile than that of Portfolio A. Suppose a stock andyst recommends buying stock in the following companies: Each of the following portfolios contains stock picks from four of the listed companles. Which of the portfolios is the least diversified? Horizon, Athens, Generic Motors, Citron Jackson \& Jackson, Fizzer, Bazer, Walreds Jackson \& Jackson, Walreds, Edides, Athena Edides, Athena, Citron, Zahoo
Step by Step Solution
There are 3 Steps involved in it

Get step-by-step solutions from verified subject matter experts