

Question: 7. Examine the given run chart or control chart and determine whether the process is within statistical control. If it is not, identify which
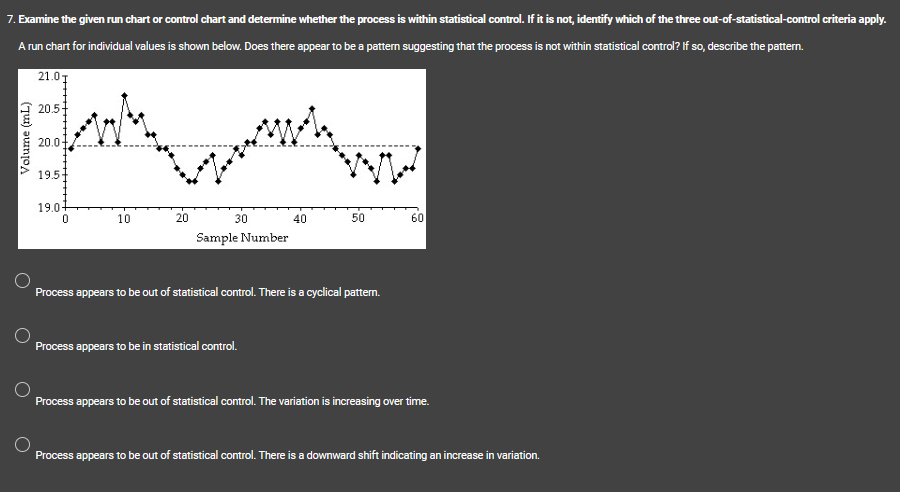
7. Examine the given run chart or control chart and determine whether the process is within statistical control. If it is not, identify which of the three out-of-statistical-control criteria apply. A run chart for individual values is shown below. Does there appear to be a pattern suggesting that the process is not within statistical control? If so, describe the pattern. 21.0 T 20.5 Volume (mL) 20.0 19.5- 19.0 0 10 20 30 wh WW Sample Number 40 50 60 Process appears to be out of statistical control. There is a cyclical pattern. Process appears to be in statistical control. Process appears to be out of statistical control. The variation is increasing over time. Process appears to be out of statistical control. There is a downward shift indicating an increase in variation.
Step by Step Solution
There are 3 Steps involved in it

Get step-by-step solutions from verified subject matter experts