

Question: 7 Exercise 7-35 Static 0.62 An analyst finds that the mean and the standard deviation of executive compensation for the 500 highest paid CEOs In


![may find it useful to reference the z table.] a. Is it](https://s3.amazonaws.com/si.experts.images/answers/2024/06/667dba93114a3_794667dba92ec48d.jpg)
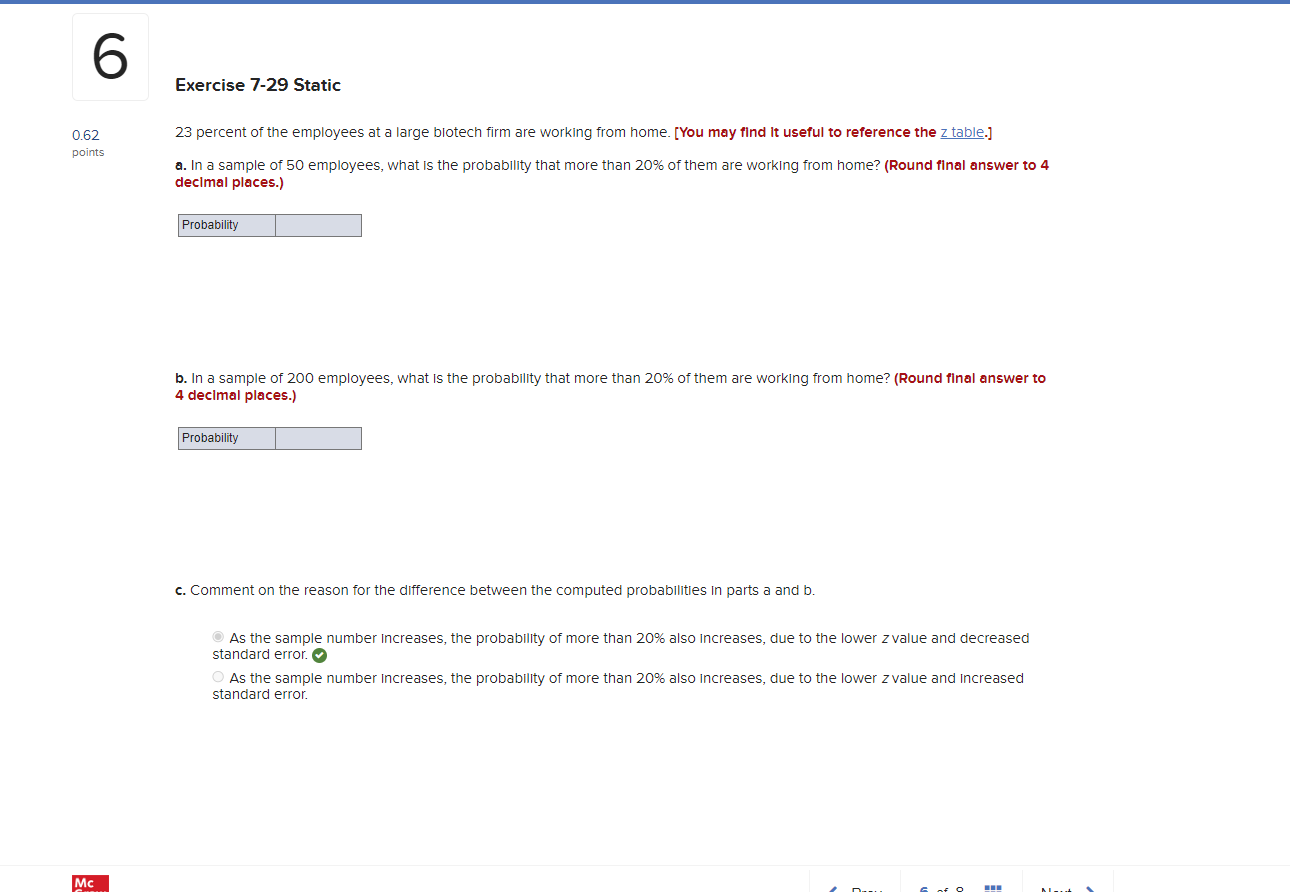
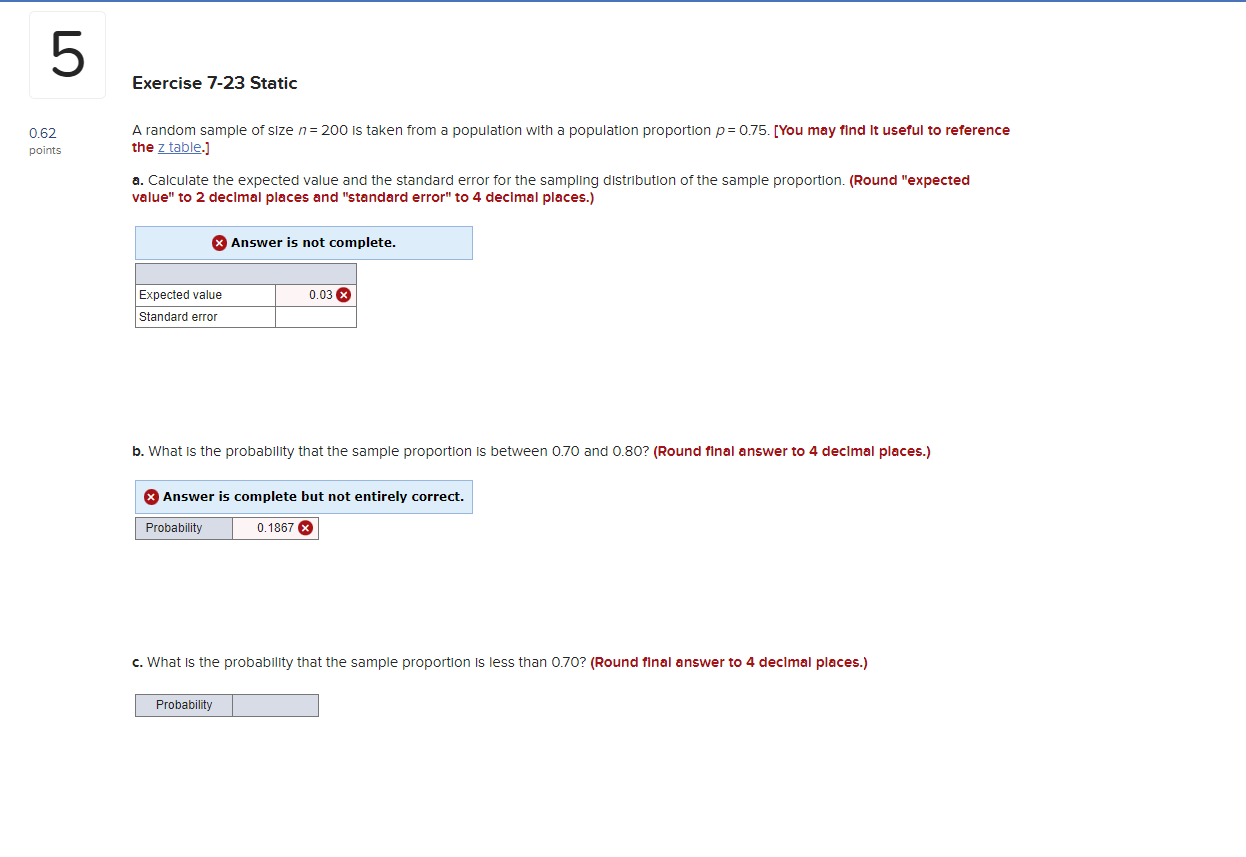
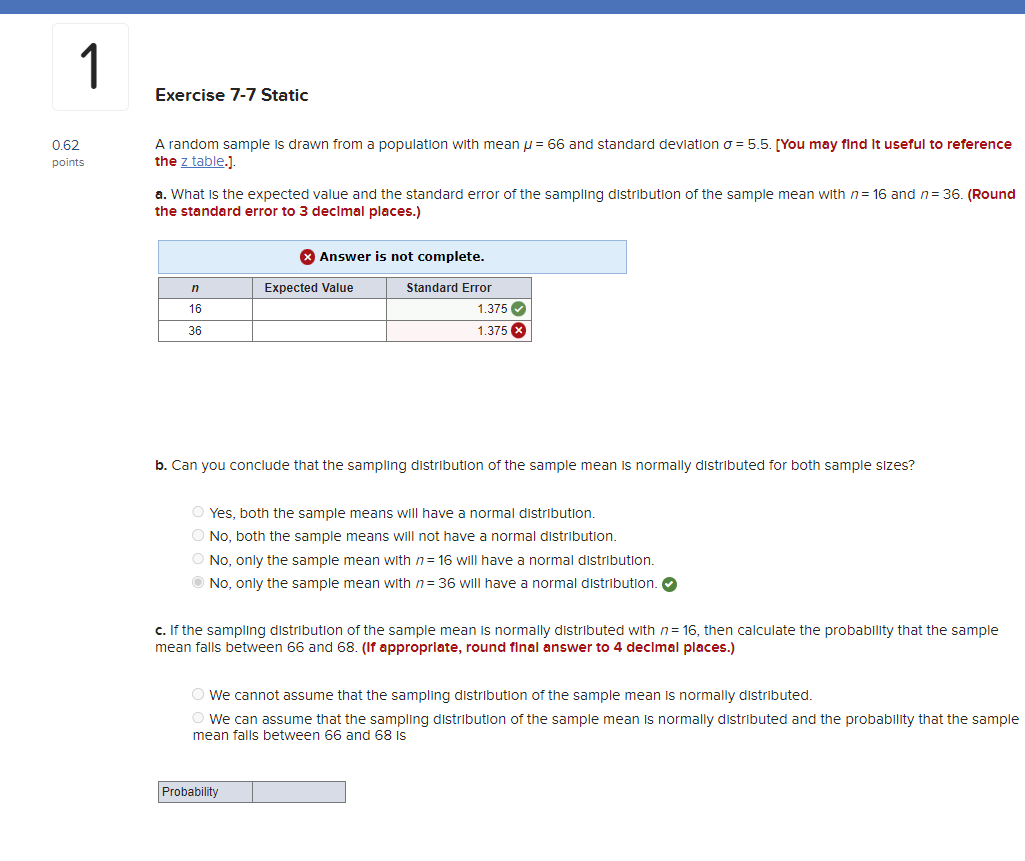
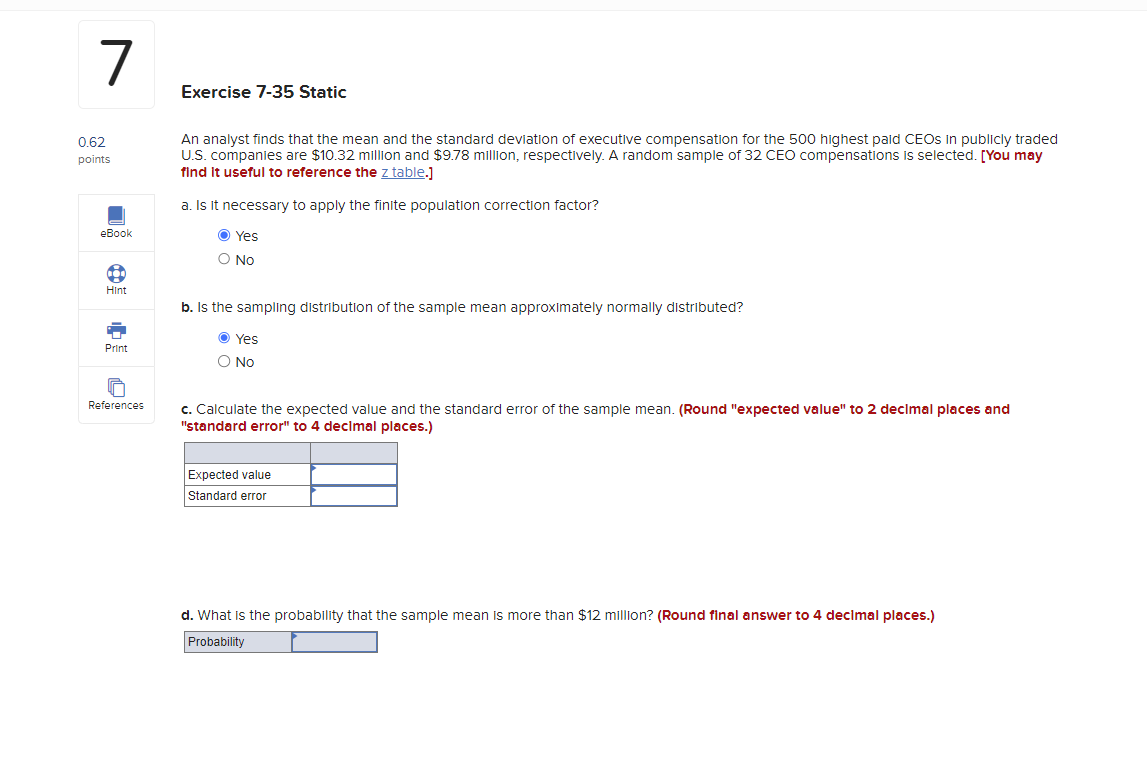
7 Exercise 7-35 Static 0.62 An analyst finds that the mean and the standard deviation of executive compensation for the 500 highest paid CEOs In publicly traded points U.S. companies are $10.32 million and $9.78 million, respectively. A random sample of 32 CEO compensations is selected. [You may find it useful to reference the z table.] a. Is it necessary to apply the finite population correction factor? eBook O Yes O No Hint b. Is the sampling distribution of the sample mean approximately normally distributed? O Yes Print O No References c. Calculate the expected value and the standard error of the sample mean. (Round "expected value" to 2 decimal places and "standard error" to 4 decimal places.) Expected value Standard error d. What is the probability that the sample mean is more than $12 million? (Round final answer to 4 decimal places.) Probability6 Exercise 7-29 Static 0.62 23 percent of the employees at a large biotech firm are working from home. [You may find it useful to reference the z table.] points a. In a sample of 50 employees, what is the probability that more than 20% of them are working from home? (Round final answer to 4 decimal places.) Probability b. In a sample of 200 employees, what is the probability that more than 20% of them are working from home? (Round final answer to 4 decimal places.) Probability c. Comment on the reason for the difference between the computed probabilities in parts a and b. As the sample number increases, the probability of more than 20% also increases, due to the lower z value and decreased standard error. As the sample number increases, the probability of more than 20% also increases, due to the lower z value and Increased standard error. Mc5 Exercise 7-23 Static 0.62 A random sample of size /= 200 is taken from a population with a population proportion p = 0.75. [You may find It useful to reference points the z table.] a. Calculate the expected value and the standard error for the sampling distribution of the sample proportion. (Round "expected value" to 2 decimal places and "standard error" to 4 decimal places.) x Answer is not complete. Expected value 0.03 x ndard error b. What is the probability that the sample proportion is between 0.70 and 0.80? (Round final answer to 4 decimal places.) x Answer is complete but not entirely correct. Probability 0. 1867 x c. What is the probability that the sample proportion is less than 0.70? (Round final answer to 4 decimal places.) ProbabilityExercise 7-7 Static 0.62 A random sample is drawn from a population with mean / = 66 and standard deviation o = 5.5. [You may find It useful to reference points the z table.]. a. What is the expected value and the standard error of the sampling distribution of the sample mean with /= 16 and / = 36. (Round the standard error to 3 decimal places.) x Answer is not complete. Expected Value Standard Error 16 1.375 36 1.375 x b. Can you conclude that the sampling distribution of the sample mean is normally distributed for both sample sizes? O Yes, both the sample means will have a normal distribution. O No, both the sample means will not have a normal distribution. O No, only the sample mean with /= 16 will have a normal distribution. O No, only the sample mean with /= 36 will have a normal distribution. c. If the sampling distribution of the sample mean is normally distributed with /= 16, then calculate the probability that the sample mean falls between 66 and 68. (If appropriate, round final answer to 4 decimal places.) O We cannot assume that the sampling distribution of the sample mean is normally distributed. O We can assume that the sampling distribution of the sample mean is normally distributed and the probability that the sample mean falls between 66 and 68 Is Probability
Step by Step Solution
There are 3 Steps involved in it

Get step-by-step solutions from verified subject matter experts