

Question: 7 ) Find the World Bank World Development Indicators online and go to the databank, and click World Development Indicators. This database is an incredible
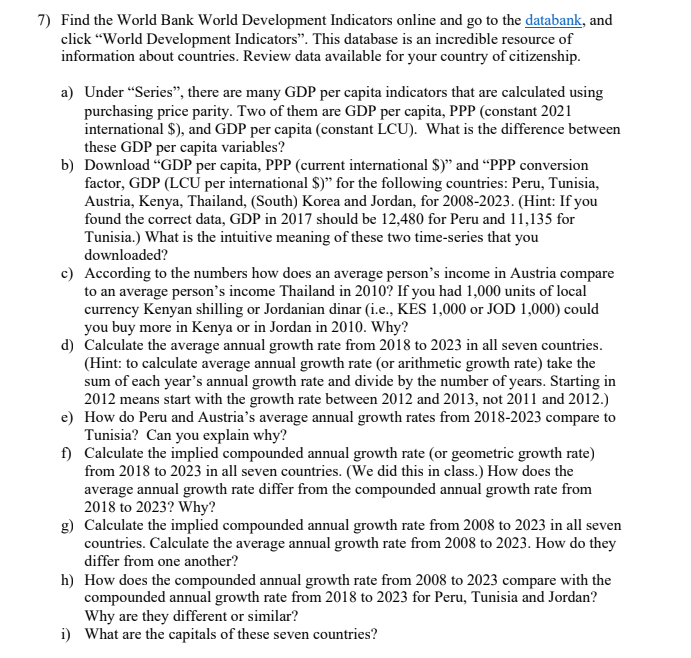
Find the World Bank World Development Indicators online and go to the databank, and click "World Development Indicators". This database is an incredible resource of information about countries. Review data available for your country of citizenship.
a Under "Series", there are many GDP per capita indicators that are calculated using purchasing price parity. Two of them are GDP per capita, PPP constant international $ and GDP per capita constant LCU What is the difference between these GDP per capita variables?
b Download GDP per capita, PPP current international $ and PPP conversion factor, GDP LCU per international $ for the following countries: Peru, Tunisia, Austria, Kenya, Thailand, South Korea and Jordan, for Hint: If you found the correct data, GDP in should be for Peru and for Tunisia. What is the intuitive meaning of these two timeseries that you downloaded?
c According to the numbers how does an average person's income in Austria compare to an average person's income Thailand in If you had units of local currency Kenyan shilling or Jordanian dinar ie KES or JOD could you buy more in Kenya or in Jordan in Why?
d Calculate the average annual growth rate from to in all seven countries. Hint: to calculate average annual growth rate or arithmetic growth rate take the sum of each year's annual growth rate and divide by the number of years. Starting in means start with the growth rate between and not and
e How do Peru and Austria's average annual growth rates from compare to Tunisia? Can you explain why?
f Calculate the implied compounded annual growth rate or geometric growth rate from to in all seven countries. We did this in class. How does the average annual growth rate differ from the compounded annual growth rate from to Why?
g Calculate the implied compounded annual growth rate from to in all seven countries. Calculate the average annual growth rate from to How do they differ from one another?
h How does the compounded annual growth rate from to compare with the compounded annual growth rate from to for Peru, Tunisia and Jordan? Why are they different or similar?
i What are the capitals of these seven countries?
Step by Step Solution
There are 3 Steps involved in it
1 Expert Approved Answer
Step: 1 Unlock

Question Has Been Solved by an Expert!
Get step-by-step solutions from verified subject matter experts
Step: 2 Unlock
Step: 3 Unlock