

Question: 7. In a single graph, show the holding cost, purchasing cost, order cost, and annual inventory cost developing different order quantities between 75 and
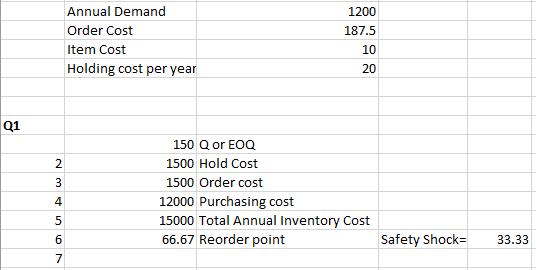
7. In a single graph, show the holding cost, purchasing cost, order cost, and annual inventory cost developing different order quantities between 75 and 200 like what I showed in class. (100pt) depletion in Also, you 8. Using an excel graph, show the order quantity different cycles. Like the graph presented below. need to show the reorder point line parallel to the time axis. (100pt) Q1 234 567 Annual Demand Order Cost Item Cost Holding cost per year 1200 187.5 10 20 150 Q or EOQ 1500 Hold Cost 1500 Order cost 12000 Purchasing cost 15000 Total Annual Inventory Cost 66.67 Reorder point Safety Shock= 33.33
Step by Step Solution
3.38 Rating (167 Votes )
There are 3 Steps involved in it
Answers periods per year o 360 Annual demand D 1200 Order cost or setup cost S 1875 item co... View full answer

Get step-by-step solutions from verified subject matter experts