

Question: 7. In multiple regression analysis, R2 increases to the extent that: The predictor variables are lowly correlated with one another (i.e., when there is low
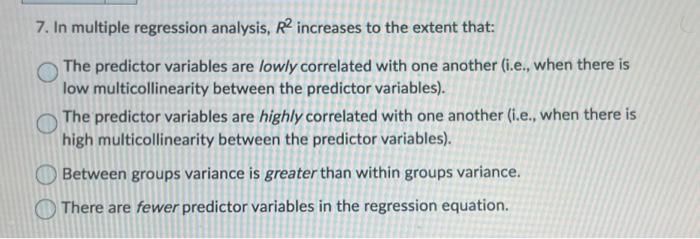
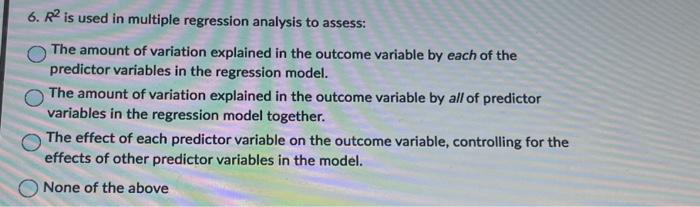
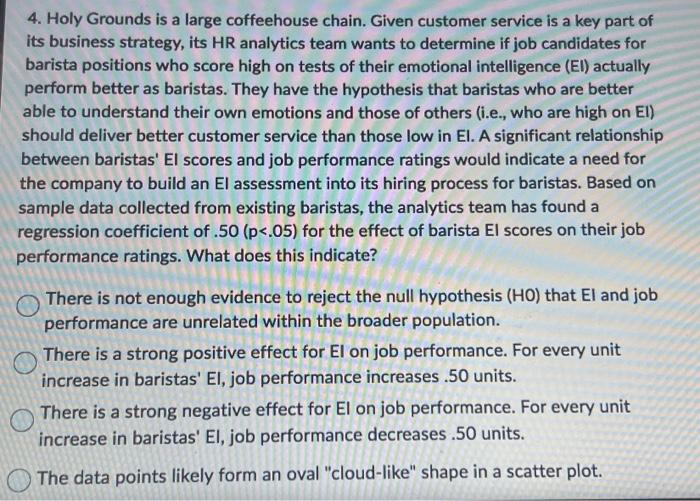
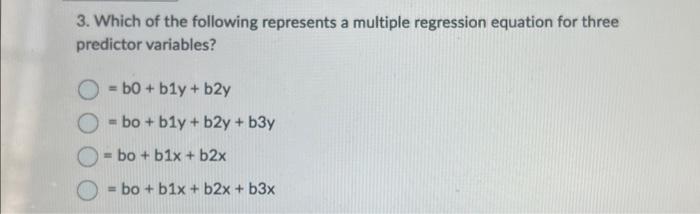
7. In multiple regression analysis, R2 increases to the extent that: The predictor variables are lowly correlated with one another (i.e., when there is low multicollinearity between the predictor variables). The predictor variables are highly correlated with one another (i.e., when there is high multicollinearity between the predictor variables). Between groups variance is greater than within groups variance. There are fewer predictor variables in the regression equation.6. R2 is used in multiple regression analysis to assess: O The amount of variation explained in the outcome variable by each of the predictor variables in the regression model. O The amount of variation explained in the outcome variable by all of predictor variables in the regression model together. The effect of each predictor variable on the outcome variable, controlling for the effects of other predictor variables in the model. ONone of the above4. Holy Grounds is a large coffeehouse chain. Given customer service is a key part of its business strategy, its HR analytics team wants to determine if job candidates for barista positions who score high on tests of their emotional intelligence (EI) actually perform better as baristas. They have the hypothesis that baristas who are better able to understand their own emotions and those of others (i.e., who are high on El) should deliver better customer service than those low in El. A significant relationship between baristas' El scores and job performance ratings would indicate a need for the company to build an El assessment into its hiring process for baristas. Based on sample data collected from existing baristas, the analytics team has found a regression coefficient of .50 (p<.05 for the effect of barista el scores on their job performance ratings. what does this indicate o there is not enough evidence to reject null hypothesis that and are unrelated within broader population. a strong positive performance. every unit increase in baristas increases .50 units. negative decreases data points likely form an oval shape scatter plot.3. which following represents multiple regression equation three predictor variables b0 bly b2y="bo" b3y="bo" b1x b2x="bo" bix>
Step by Step Solution
There are 3 Steps involved in it

Get step-by-step solutions from verified subject matter experts