

Question: 7 MSE MAPE Method X Method Y Method z Method w MAD 30 25 27 4500 5400 14.5% 13.0% 12.5% 13.5% 3500 28 5000 Three
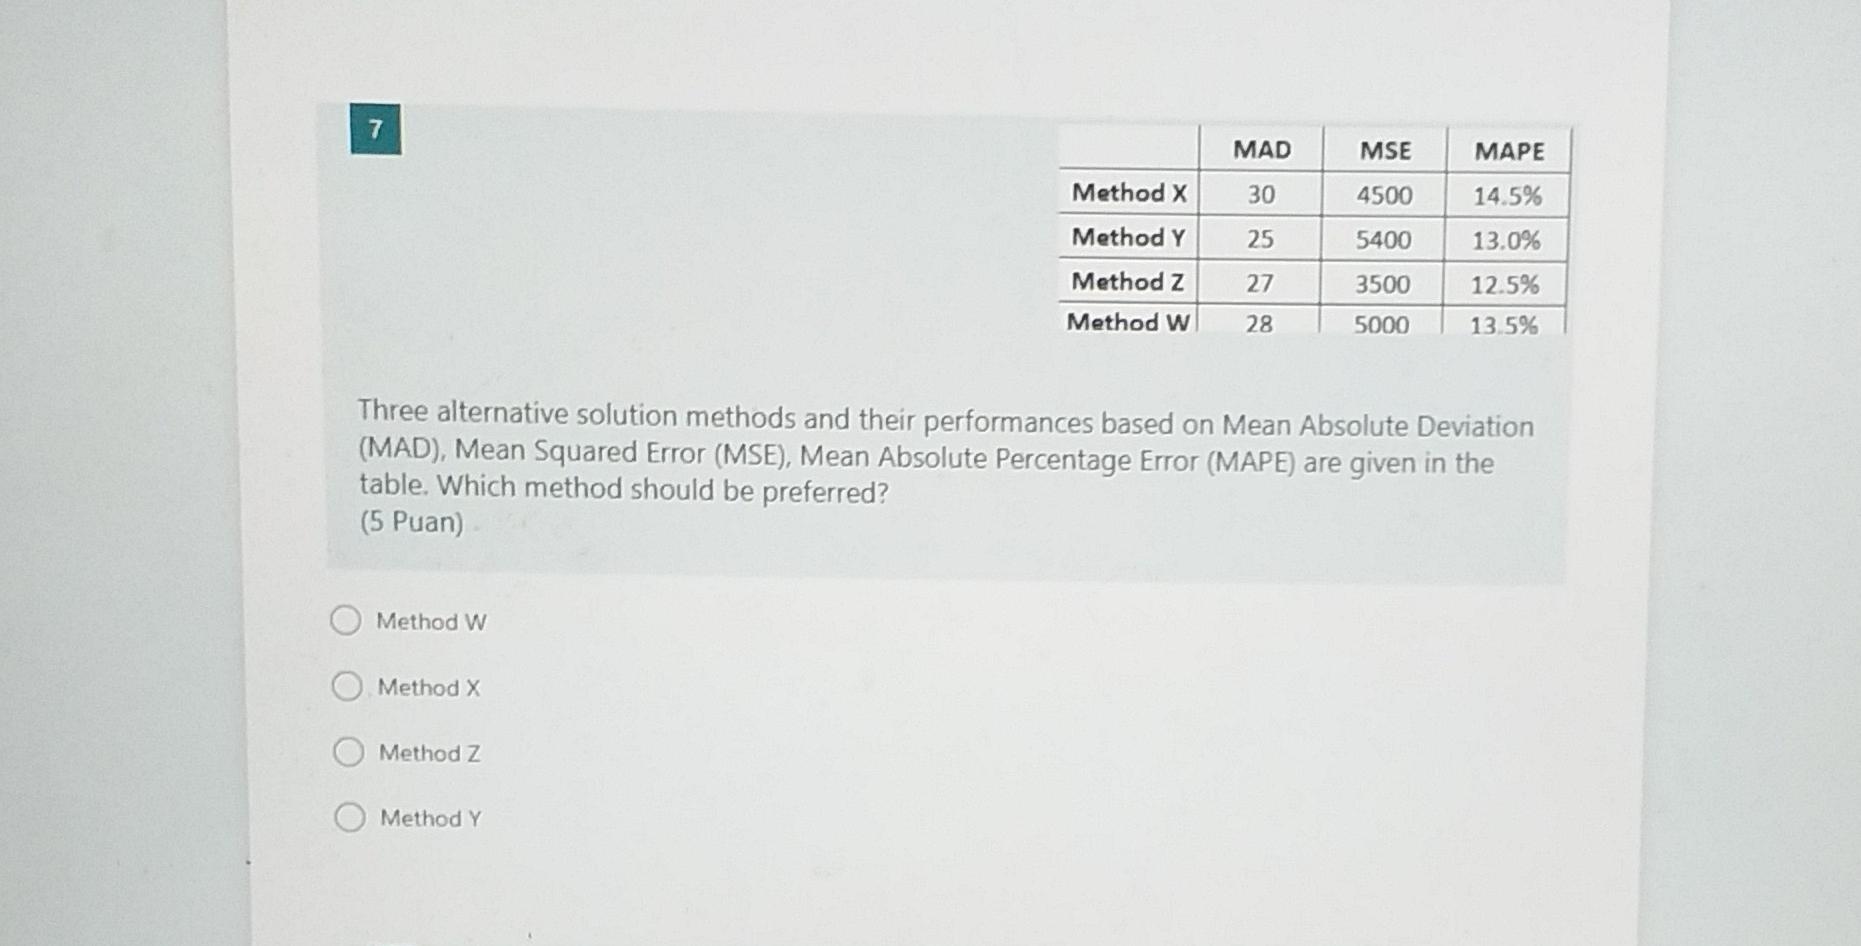
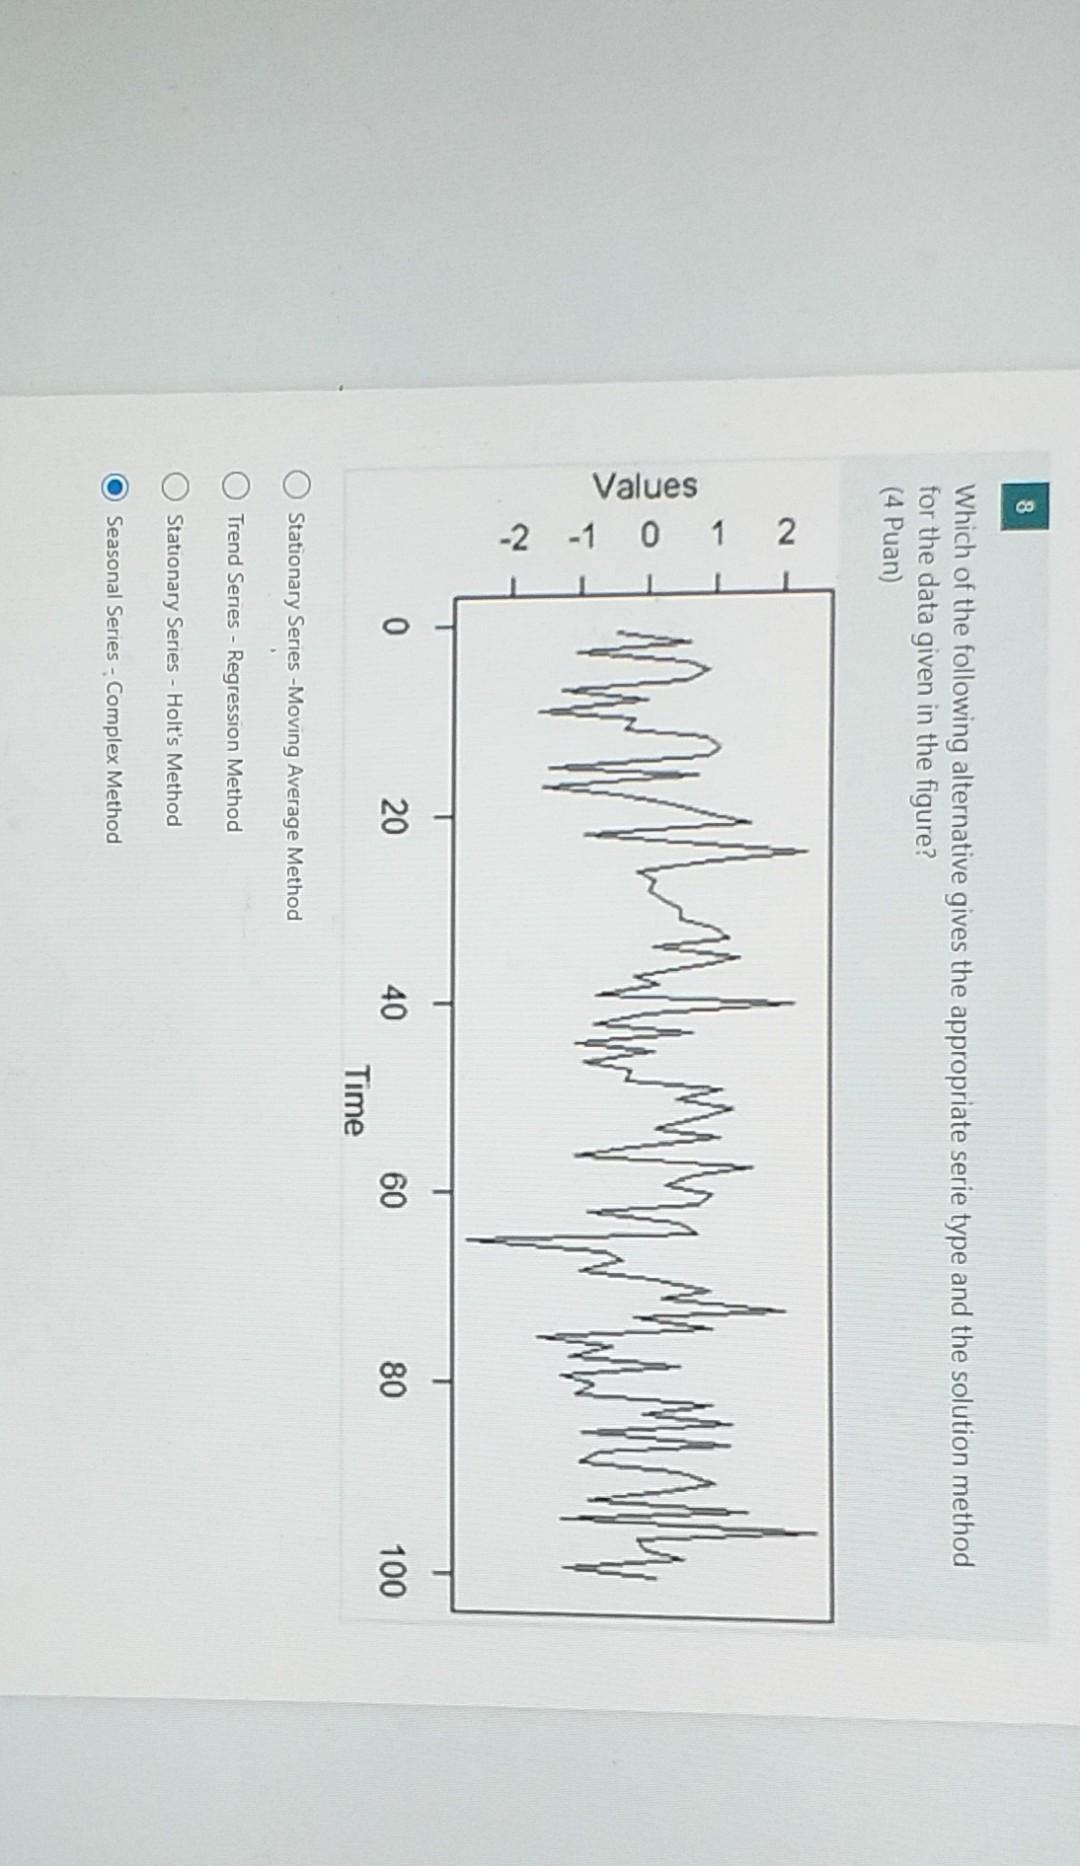
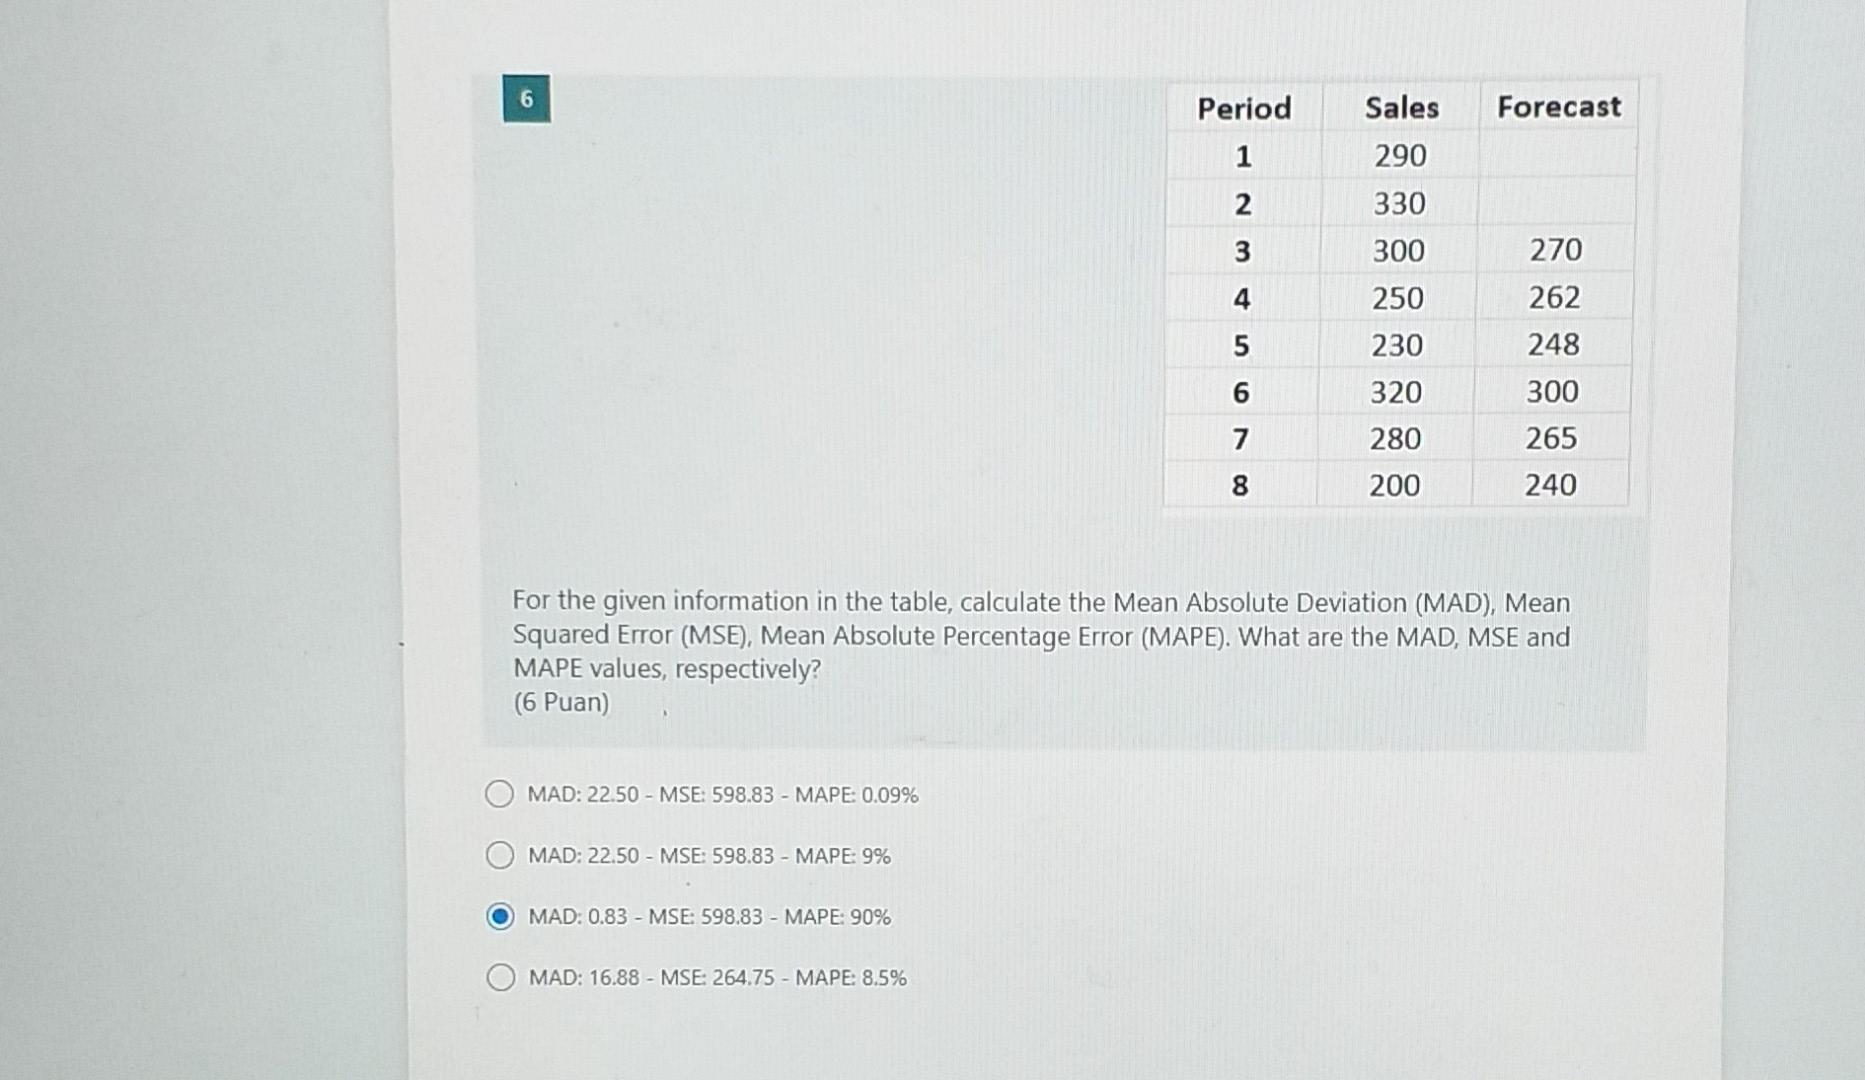
7 MSE MAPE Method X Method Y Method z Method w MAD 30 25 27 4500 5400 14.5% 13.0% 12.5% 13.5% 3500 28 5000 Three alternative solution methods and their performances based on Mean Absolute Deviation (MAD), Mean Squared Error (MSE), Mean Absolute Percentage Error (MAPE) are given in the table. Which method should be preferred? (5 Puan) Method w Method X Method Z Method Y 8 Which of the following alternative gives the appropriate serie type and the solution method for the data given in the figure? (4 Puan) 2 - 1 Values -1 0 , -2 0 20 40 60 80 100 Time Stationary Series -Moving Average Method Trend Series - Regression Method Stationary Series - Holt's Method Seasonal Series - Complex Method 6 Period Sales Forecast 1 290 2 330 3 4 4 300 250 230 5 270 262 248 300 265 240 320 6 7 280 8 200 For the given information in the table, calculate the Mean Absolute Deviation (MAD), Mean Squared Error (MSE), Mean Absolute Percentage Error (MAPE). What are the MAD, MSE and MAPE values, respectively? (6 Puan) MAD: 22.50 - MSE: 598.83 - MAPE: 0.09% MAD: 22.50 - MSE: 598.83 - MAPE: 9% MAD. 0.83 - MSE: 598.83 - MAPE: 90% MAD: 16.88 - MSE: 264.75 - MAPE: 8.5%
Step by Step Solution
There are 3 Steps involved in it
1 Expert Approved Answer
Step: 1 Unlock

Question Has Been Solved by an Expert!
Get step-by-step solutions from verified subject matter experts
Step: 2 Unlock
Step: 3 Unlock