

Question: (7%) Problem 12: The figure below illustrates an energy level diagram for hydrogen, with several electron transitions indicated by arrows. Arrange the letters corresponding to
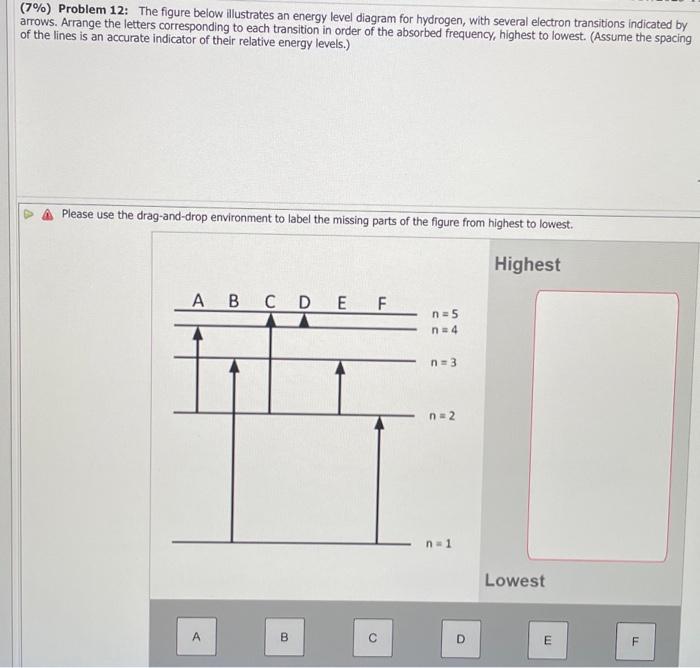
(7\%) Problem 12: The figure below illustrates an energy level diagram for hydrogen, with several electron transitions indicated by arrows. Arrange the letters corresponding to each transition in order of the absorbed frequency, highest to lowest. (Assume the spacing of the lines is an accurate indicator of their relative energy levels.) A Please use the drag-and-drop environment to label the missing parts of the figure from highest to lowest. Highest Lowest
Step by Step Solution
There are 3 Steps involved in it
1 Expert Approved Answer
Step: 1 Unlock

Question Has Been Solved by an Expert!
Get step-by-step solutions from verified subject matter experts
Step: 2 Unlock
Step: 3 Unlock