

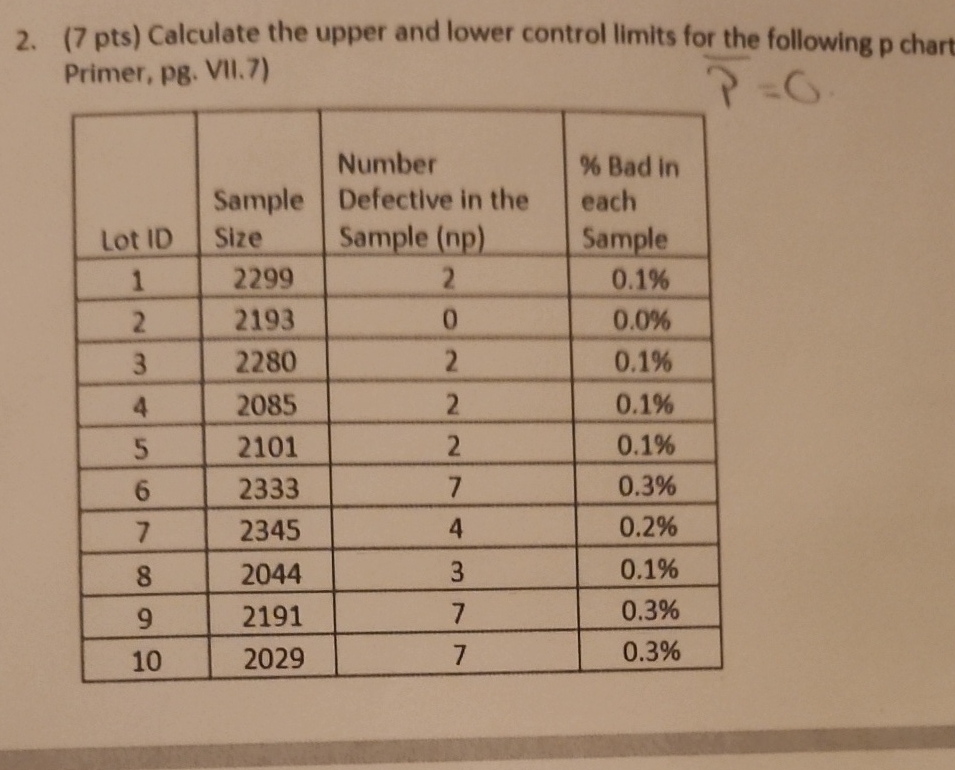
Question: ( 7 pts ) Calculate the upper and lower control limits for the following p chart Primer, pg . VII . 7 ) table
pts Calculate the upper and lower control limits for the following p chart Primer, pg VII
tabletableSampleSizetableNumberDefective in theSample nptable Bad ineachSample
Step by Step Solution
There are 3 Steps involved in it
1 Expert Approved Answer
Step: 1 Unlock

Question Has Been Solved by an Expert!
Get step-by-step solutions from verified subject matter experts
Step: 2 Unlock
Step: 3 Unlock