Question: 7. Refer to the table Factors for Computing Control Chart Limits (3.sigma)' for this problem. Pet Products, Inc., caters to the growing market for at
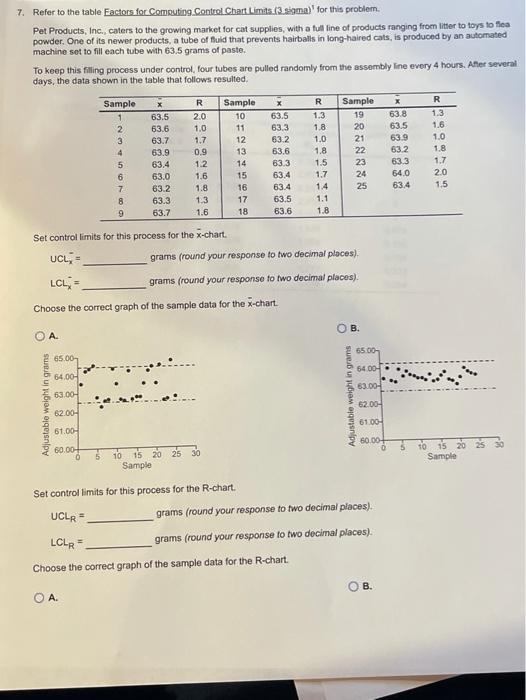
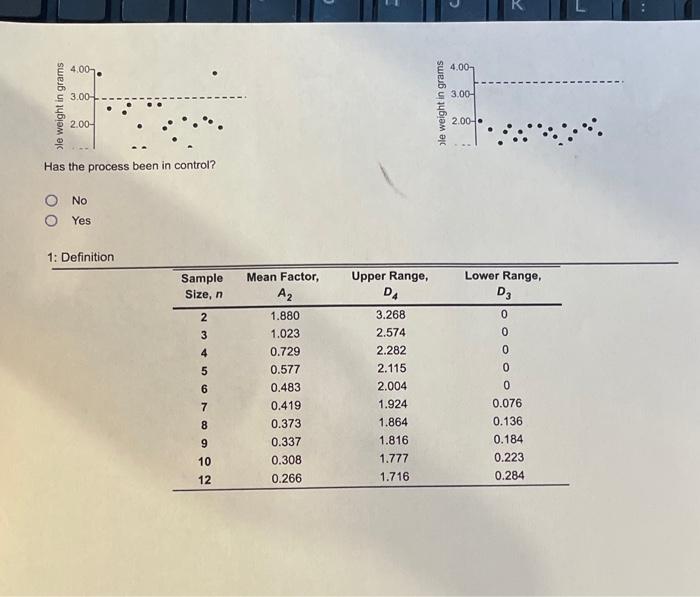
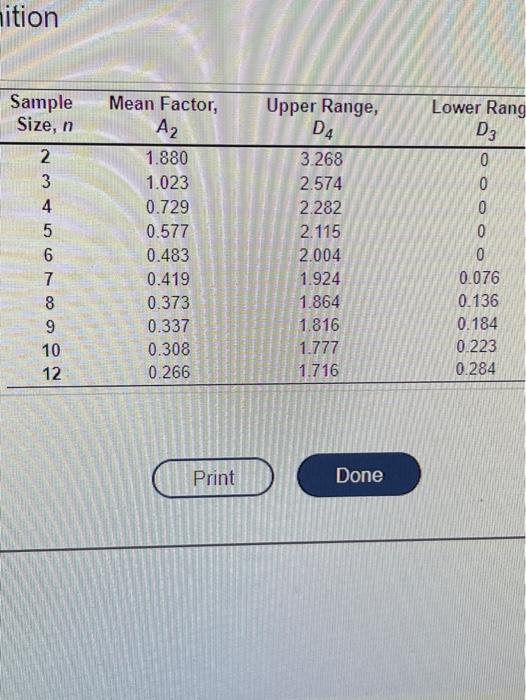
7. Refer to the table Factors for Computing Control Chart Limits (3.sigma)' for this problem. Pet Products, Inc., caters to the growing market for at supplies, with a full line of products ranging from litter to toys to fhea powder. One of its newer products, a tube of fuld that prevents hairballs in long-haired cats, is produced by an automated machine set to fill each tube with 63.5 grams of paste. To keep this filling process under control, four tubes are pulled randomly from the assembly in every 4 hours. After several days, the data shown in the table that follows resulted. R X Sample 1 2 3 4 5 6 7 8 x 63.5 63.6 63.7 63.9 63.4 63.0 63.2 63.3 63.7 R 2.0 1.0 1.7 0.9 1.2 1.6 1.8 1.3 1.6 Sample 10 11 12 13 14 15 16 17 18 63,5 63.3 63.2 63.6 833 63.4 63.4 63.5 63.6 R 1.3 1.8 1.0 1.8 1.5 1.7 1.4 1.1 1.8 Sample 19 20 21 22 23 24 25 X 63.8 63.5 63.9 632 63.3 640 63.4 1.3 1.6 1.0 1.8 1.7 20 1.5 Set control limits for this process for the x-chart. UCL, grams (round your response to two decimal places) LCL grams (round your response to two decimal places) Choose the correct graph of the sample data for the X-chart. OB A. 65.00 65.00 6400 69.00-1 weight in grams Adjustable 64.00 63.00 62.00 Adjustable weight in grams 62.00- 61.00 60.00 61.00 60.00 10 15 20 25 30 Sample 3 10 is 20 Sample Set controllimits for this process for the R-chart. UCLR = grams (round your response to two decimal places). LCLR grams (round your response to two decimal places). Choose the correct graph of the sample data for the R-chart. . , c 4.00 4.00 3.00-1 3.00- ole weight in grams ple weight in grams 2.00- 2.00- Has the process been in control? No O Yes 1: Definition Sample Size, n 2 3 4 5 6 Mean Factor, A2 1.880 1.023 0.729 0.577 0.483 0.419 0.373 0.337 0.308 0.266 Upper Range, DA 3.268 2.574 2.282 2.115 2.004 1.924 1.864 1.816 1.777 1.716 Lower Range, D 0 0 0 0 0 0.076 0.136 0.184 0.223 0.284 7 8 9 10 12 nition Sample Size, n Lower Rang D3 0 0 0 2 3 4 5 6 7 8 9 10 12 Mean Factor, A2 1.880 1.023 0.729 0.577 0.483 0.419 0.373 0.337 0.308 0.266 Upper Range, D4 3.268 2.574 2.282 2.115 2.004 1.924 1.864 1.816 1.777 1.716 0 0.076 0.136 0.184 0.223 0.284 Print Done