

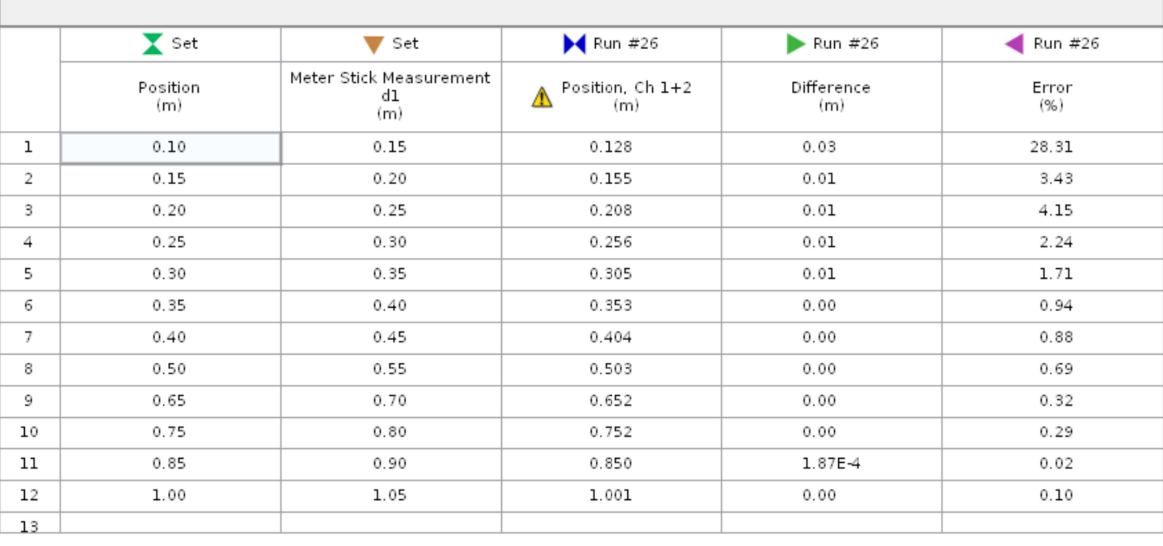
Question: 7 Set )4 Run #26 p Run #26 ' Run #26 Position Meter Stick gleesurement ' Position. Ch 1+2 Difference Error {m} [m] (m)
![[m] (m) (m) m 1 0.15 0.123 0.03 23.31 2 0.15 0.20](https://s3.amazonaws.com/si.experts.images/answers/2024/07/668808019a07c_977668808016bb96.jpg)
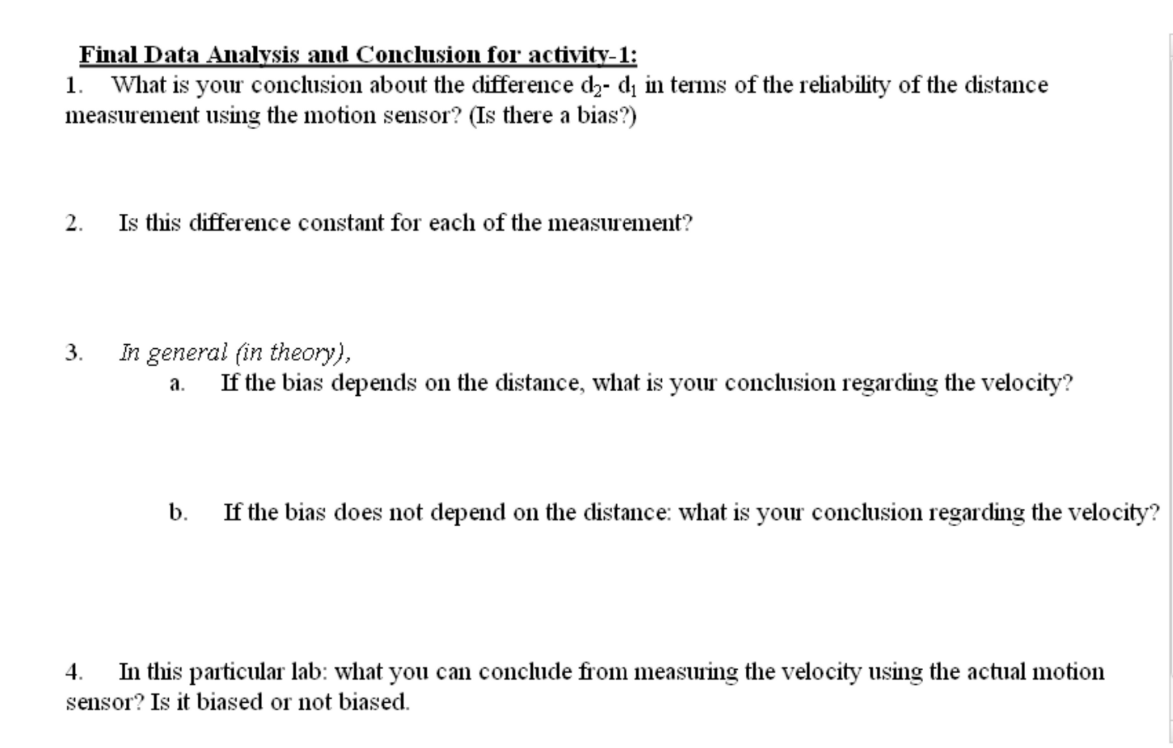
\" 7 Set )4 Run #26 p Run #26 ' Run #26 Position Meter Stick gleesurement ' Position. Ch 1+2 Difference Error {m} [m] (m) (m) m 1 0.15 0.123 0.03 23.31 2 0.15 0.20 0.155 0.01 3.43 3 0.25 0.203 0.01 4.15 5 m 0.35 0.305 0.01 1.71 6 0.35 0.40 0.353 0.00 0.94 7 0.45 0.404 0.00 0.33 3 u 0.55 0.503 0.00 0.69 9 0.32 10 0.29 11 0.02 12 0.10 Final Data Analysis and Conclusion for activity-1: 1. What is your conclusion about the difference d2- dj in terms of the reliability of the distance measurement using the motion sensor? (Is there a bias?) 2. Is this difference constant for each of the measurement? 3. In general (in theory), a. If the bias depends on the distance, what is your conclusion regarding the velocity? b. If the bias does not depend on the distance: what is your conclusion regarding the velocity? 4. In this particular lab: what you can conclude from measuring the velocity using the actual motion sensor? Is it biased or not biased.\fVelocity 2 Snapshot 1.2 V3 V Run #92 1.0 - 61 . 0.240 m/s Set 0.8- 0.6- 0.4 Velocity (m/s) 0.2- 0.0.............40 -0.2 - Linear Score -0.4 mindex + b SV3 m = 0.00803 + 3.5x10⁻⁴ Run #92 -0.6 - b = -0.332 + 0.022 r = 0.999 62.7 -0.8 - 0 10 20 30 40 50 60 70 80 90 100 IndexAnalysis-2 Snapshot Final Data Analysis and Conclusion for activity-2: 1. What is the percent difference between the slope of your line and the slope of the theoretical line? 2. On the Position plot, what is happening between 5 and 10 seconds? 3. What parts of the plot were easier to match? What parts of the plot were the hardest to match? Why? 4. What is the difference between the parts of the plot with positive slope and the parts with negative slope? 5. Consider the Velocity 2 plot. Where is the acceleration largest? What is the speed at that point
Step by Step Solution
There are 3 Steps involved in it

Get step-by-step solutions from verified subject matter experts