

Question: 7. The following graphs represent before and after dissociation for a Strong acid with low electrical conductivity Strong acid which dissociates in water more than
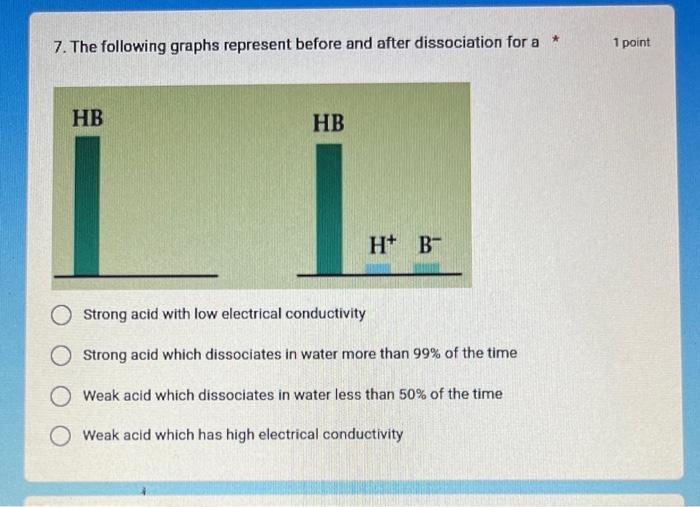
7. The following graphs represent before and after dissociation for a Strong acid with low electrical conductivity Strong acid which dissociates in water more than 99% of the time Weak acid which dissociates in water less than 50% of the time Weak acid which has high electrical conductivity
Step by Step Solution
There are 3 Steps involved in it
1 Expert Approved Answer
Step: 1 Unlock

Question Has Been Solved by an Expert!
Get step-by-step solutions from verified subject matter experts
Step: 2 Unlock
Step: 3 Unlock