

Question: 7. The following scatterplot depicts the regression line for predicting a student's weekly hours of exercise (Q33) from wither or not he or she is
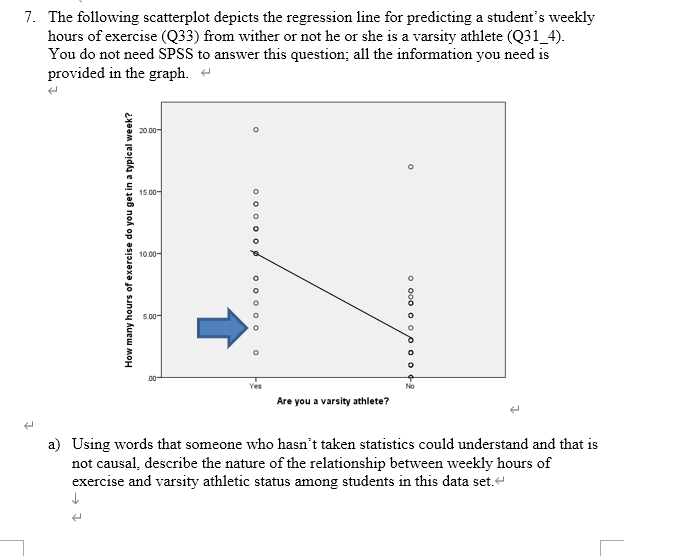
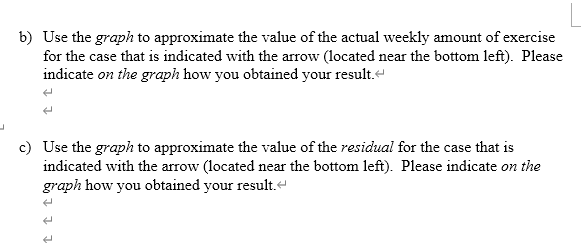
7. The following scatterplot depicts the regression line for predicting a student's weekly hours of exercise (Q33) from wither or not he or she is a varsity athlete (Q31_4). You do not need SPSS to answer this question; all the information you need is provided in the graph. + 20.00- O 15 00- gooooo How many hours of exercise do you get in a typical week? 10 00- 5.00- To o o o o o ooo o Yes Are you a varsity athlete? a) Using words that someone who hasn't taken statistics could understand and that is not causal, describe the nature of the relationship between weekly hours of exercise and varsity athletic status among students in this data set.~b) Use the graph to approximate the value of the actual weekly amount of exercise for the case that is indicated with the arrow (located near the bottom left). Please indicate on the graph how you obtained your result.~ t c) Use the graph to approximate the value of the residual for the case that is indicated with the arrow (located near the bottom left). Please indicate on the graph how you obtained your result.~
Step by Step Solution
There are 3 Steps involved in it

Get step-by-step solutions from verified subject matter experts