

Question: 7- The following table indicates the preference for different types of soft drinks by three age groups. cola root beer lemon lime under 21 years
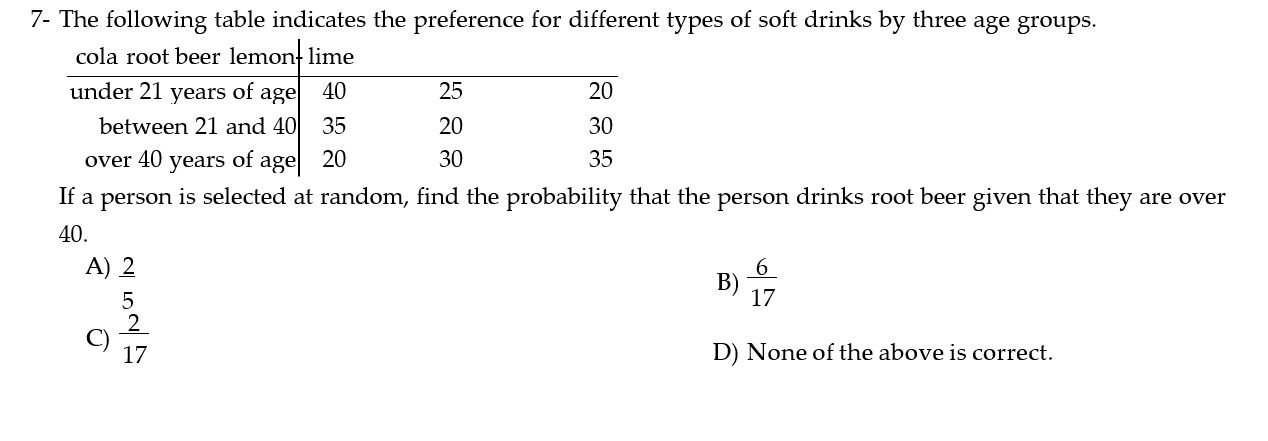
7- The following table indicates the preference for different types of soft drinks by three age groups. cola root beer lemon lime under 21 years of age 40 25 20 between 21 and 40 35 20 30 over 40 years of age 20 30 35 If a person is selected at random, find the probability that the person drinks root beer given that they are over 40. 2 6 B) 5 17 C) 17 D) None of the above is correct
Step by Step Solution
There are 3 Steps involved in it
1 Expert Approved Answer
Step: 1 Unlock

Question Has Been Solved by an Expert!
Get step-by-step solutions from verified subject matter experts
Step: 2 Unlock
Step: 3 Unlock