

Question: 7 The rule that defines function is fix x 1 Complete the table Then sketch a graph of function f rent price dollars x 2
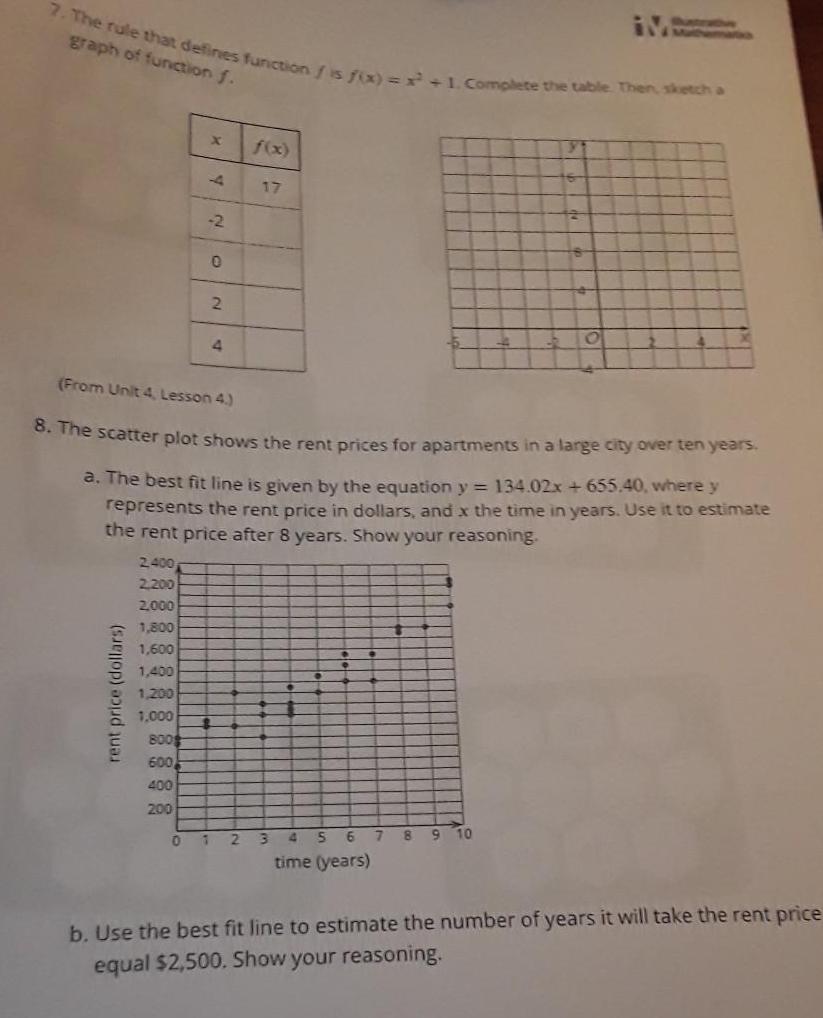

7 The rule that defines function is fix x 1 Complete the table Then sketch a graph of function f rent price dollars x 2 400 2 200 2 000 1 800 1 600 1 400 1 200 1 000 800 600 400 200 2 0 0 2 From Unit 4 Lesson 4 8 The scatter plot shows the rent prices for apartments in a large city over ten years 4 a The best fit line is given by the equation y 134 02x 655 40 where y represents the rent price in dollars and x the time in years Use it to estimate the rent price after 8 years Show your reasoning 123 4 5 6 time years 7 O 10 9 8 b Use the best fit line to estimate the number of years it will take the rent price equal 2 500 Show your reasoning
Step by Step Solution
There are 3 Steps involved in it

Get step-by-step solutions from verified subject matter experts