

Question: 7) The table below shows the concentration profile from an interdiffusion experi- ment performed at 1100C for 48 hours in an ideal binary A-B alloy.
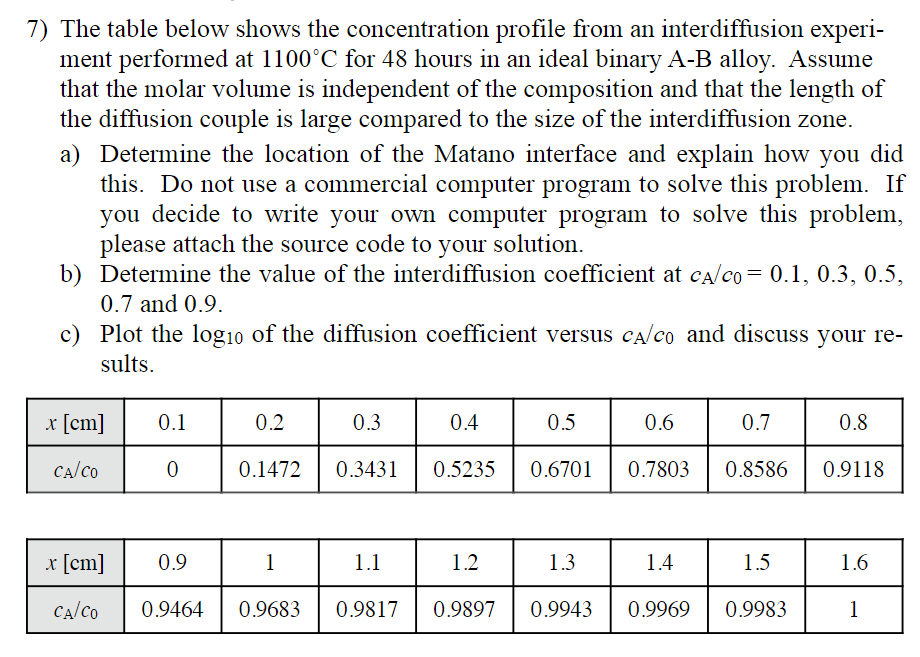
7) The table below shows the concentration profile from an interdiffusion experi- ment performed at 1100C for 48 hours in an ideal binary A-B alloy. Assume that the molar volume is independent of the composition and that the length of the diffusion couple is large compared to the size of the interdiffusion zone. a) Determine the location of the Matano interface and explain how you did this. Do not use a commercial computer program to solve this problem. If you decide to write your own computer program to solve this problem, please attach the source code to your solution. b) Determine the value of the interdiffusion coefficient at calco = 0.1, 0.3, 0.5, 0.7 and 0.9. c) Plot the logio of the diffusion coefficient versus calco and discuss your re- sults. x [cm] 0.1 0.2 0.3 0.4 | 0.5 0.6 0.7 0.8 CA/CO 0 0.1472 0.3431 0.5235 0.6701 0.7803 0.8586 0.9118 x [cm] 0.9 1 1.1 1.2 1.3 1.4 1.5 1.6 calco 0.9464 0.9683 0.9817 0.9897 0.9943 0.9969 0.9983 1
Step by Step Solution
There are 3 Steps involved in it

Get step-by-step solutions from verified subject matter experts