

Question: 7 Use graphical methods to explore the following data for possible causal relationships. 8 The table below shows a company's quarterly profit and its share
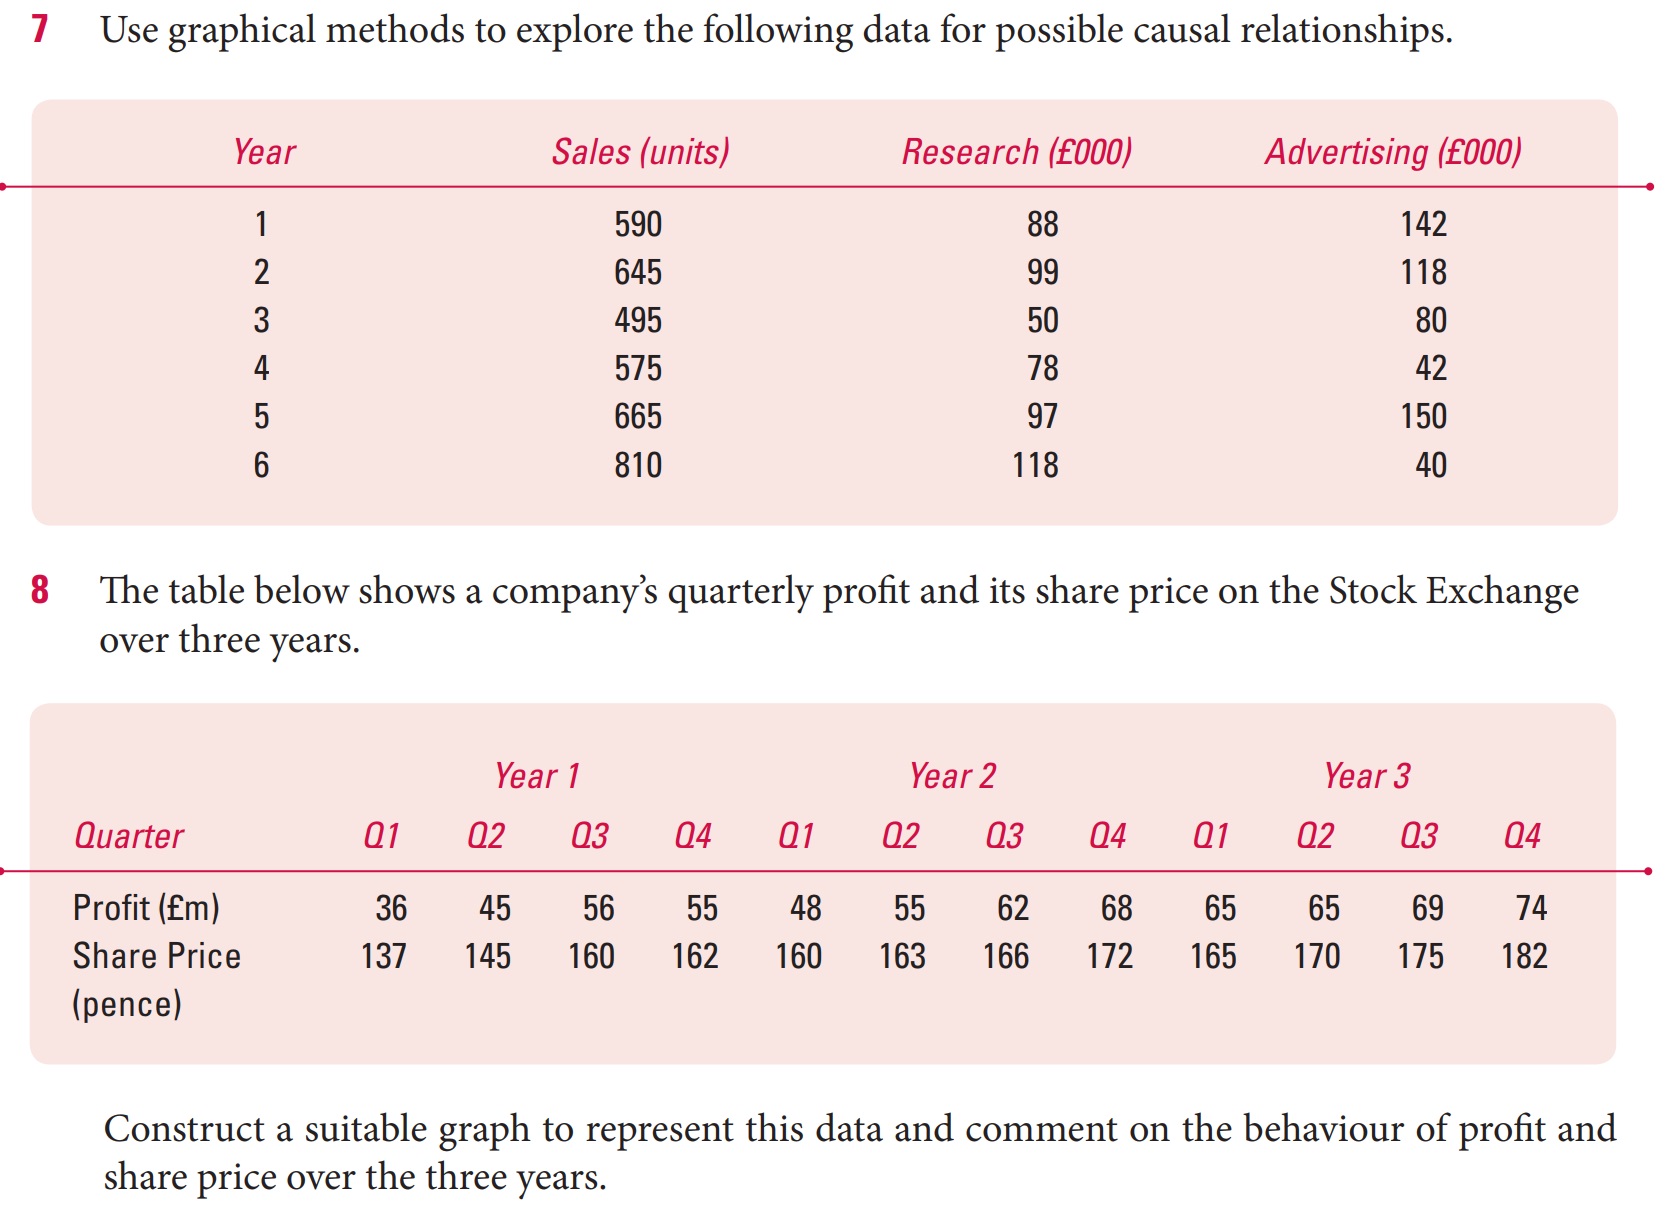
Use graphical methods to explore the following data for possible causal relationships.
The table below shows a company's quarterly profit and its share price on the Stock Exchange
over three years.
Construct a suitable graph to represent this data and comment on the behaviour of profit and
share price over the three years.
Step by Step Solution
There are 3 Steps involved in it
1 Expert Approved Answer
Step: 1 Unlock

Question Has Been Solved by an Expert!
Get step-by-step solutions from verified subject matter experts
Step: 2 Unlock
Step: 3 Unlock