

Question: 7. Use the rate-of-return data for the stock and bond funds presented in Spreadsheet 6.1, but now assume that the probability of each scenario is
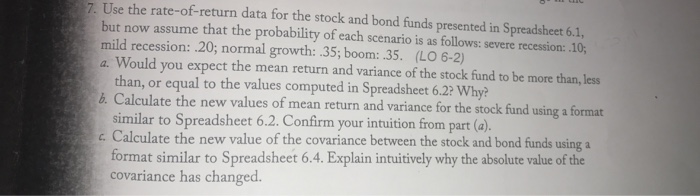
7. Use the rate-of-return data for the stock and bond funds presented in Spreadsheet 6.1, but now assume that the probability of each scenario is as follows: severe recession: 10, a. Would you expect the mean return and variance of the stock fund to be more than, less b. Calculate the new values of mean return and variance for the stock fund using a format c. Calculate the new value of the covariance between the stock and bond funds using a mild recession: .20; normal growth: .35; boom: 35. (LO 6-2) than, or equal to the values computed in Spreadsheet 6.2? Why? similar to Spreadsheet 6.2. Confirm your intuition from part (al covariance has changed. format similar to Spreadsheet 6.4. Explain intuitively why the absolute value of the 7. Use the rate-of-return data for the stock and bond funds presented in Spreadsheet 6.1, but now assume that the probability of each scenario is as follows: severe recession: 10, a. Would you expect the mean return and variance of the stock fund to be more than, less b. Calculate the new values of mean return and variance for the stock fund using a format c. Calculate the new value of the covariance between the stock and bond funds using a mild recession: .20; normal growth: .35; boom: 35. (LO 6-2) than, or equal to the values computed in Spreadsheet 6.2? Why? similar to Spreadsheet 6.2. Confirm your intuition from part (al covariance has changed. format similar to Spreadsheet 6.4. Explain intuitively why the absolute value of the
Step by Step Solution
There are 3 Steps involved in it

Get step-by-step solutions from verified subject matter experts