

Question: 70 + A A Aaw NO ACES ARCODE Sol TEXT Act A LA BCCDO ADA song AARSCOOT Abba Norma SOUND Heating Q2 mm OTTO VOICICMONTI
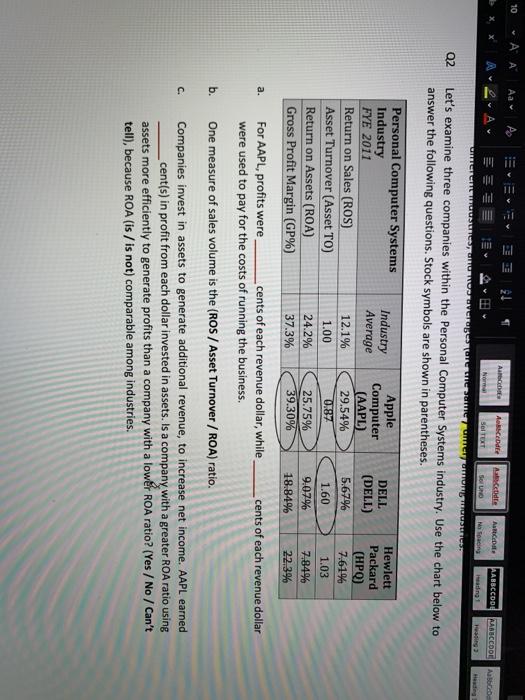
70 + A A Aaw NO ACES ARCODE Sol TEXT Act A LA BCCDO ADA song AARSCOOT Abba Norma SOUND Heating Q2 mm OTTO VOICICMONTI Let's examine three companies within the Personal Computer Systems industry. Use the chart below to answer the following questions. Stock symbols are shown in parentheses. Industry Average Personal Computer Systems Industry FYE 2011 Return on Sales (ROS) Asset Turnover (Asset TO) Return on Assets (ROA) Gross Profit Margin (GP%) Apple Computer (AAPL) 29.54% 0.87 12.1% 1.00 24.2% 37.3% DELL (DELL) 5.67% 1.60 9.07% 18.84% Hewlett Packard (HPQ) 7.619 1.03 7,84% 22.3% 25.75% 39.30% a. b. For AAPL, profits were cents of each revenue dollar, while cents of each revenue dollar were used to pay for the costs of running the business, One measure of sales volume is the (ROS / Asset Turnover / ROA) ratio. Companies invest in assets to generate additional revenue, to increase net income. AAPL earned cent(s) in profit from each dollar invested in assets. is a company with a greater ROA ratio using assets more efficiently to generate profits than a company with a lower ROA ratio? (Yes/No / Can't tell), because ROA (is / is not) comparable among industries. C
Step by Step Solution
There are 3 Steps involved in it

Get step-by-step solutions from verified subject matter experts