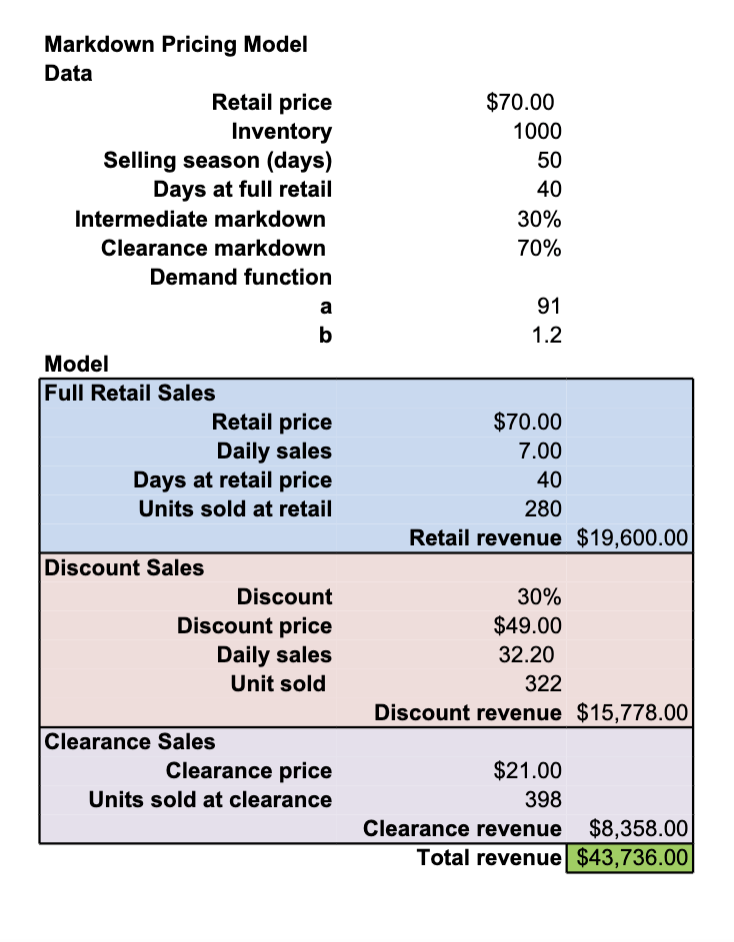
Question: $70.00 1000 50 40 30% 70% Markdown Pricing Model Data Retail price Inventory Selling season (days) Days at full retail Intermediate markdown Clearance markdown Demand

$70.00 1000 50 40 30% 70% Markdown Pricing Model$70.00 1000 50 40 30% 70% Markdown Pricing Model

$70.00 1000 50 40 30% 70% Markdown Pricing Model Data Retail price Inventory Selling season (days) Days at full retail Intermediate markdown Clearance markdown Demand function a b Model Full Retail Sales Retail price Daily sales Days at retail price Units sold at retail 91 1.2 $70.00 7.00 40 280 Retail revenue $19,600.00 Discount Sales Discount Discount price Daily sales Unit sold 30% $49.00 32.20 322 Discount revenue $15,778.00 Clearance Sales Clearance price Units sold at clearance $21.00 398 Clearance revenue $8,358.00 Total revenue $43,736.00 Q1. A department store is introducing a new brand of bathing suit. The provided complete" model in sheet Q1" calculates the revenue expected to be generated from the sales of this product. Answer the following questions based on this model. a. The store wants to find out the best possible revenue they can get by varying the two markdown percentages. Create a two-way data table by varying intermediate markdown from 4% - 40% (with increments of 4%) and clearance markdown from 50% to 80% (with increments of 6%) while keeping all of the other inputs the same. What is the highest possible total revenue? b. Find the retail price of this product that generates exactly $45,000 in total revenue keeping everything else the same. Q2. Grills-R-us, manufacturer of outdoor BBQ grills, is planning ahead for the coming summer season for one of its products. The price per unit will be $495. The cost of manufacturing each grill is a random variable and thought to have a uniform distribution between $220 to $260 per unit. The fixed cost also thought to have a uniform distribution and expected to be between $700,000 to $800,000. From historical data the company anticipates that the demand for their product will have a normal distribution with a mean of 4,000 units and a standard deviation of 500 units. Based on expected demand the company plans to produce 4000 units. Any unsold units can be sold at the end of the summer season at a discounted price of $195 each. a. Create a simulation model to calculate the expected average profit for this product for the coming summer season? b. What is the probability that the product will generate a loss? c. Create a frequency distribution (using the FREQUENCY() function) and a histogram (using a column chart) for the profit. For your calculations use the minimum and the maximum expected profit values to determine a reasonable range and use increments of $40,000. d. The company is considering producing 5,000 or 6,000 units as an alternative to the current strategy of 4,000 units. Compute and compare the average expected profit values and probability of loss for each production level. What's your conclusion

Step by Step Solution

There are 3 Steps involved in it

1 Expert Approved Answer
Step: 1 Unlock blur-text-image
Question Has Been Solved by an Expert!

Get step-by-step solutions from verified subject matter experts

Step: 2 Unlock
Step: 3 Unlock

Students Have Also Explored These Related General Management Questions!