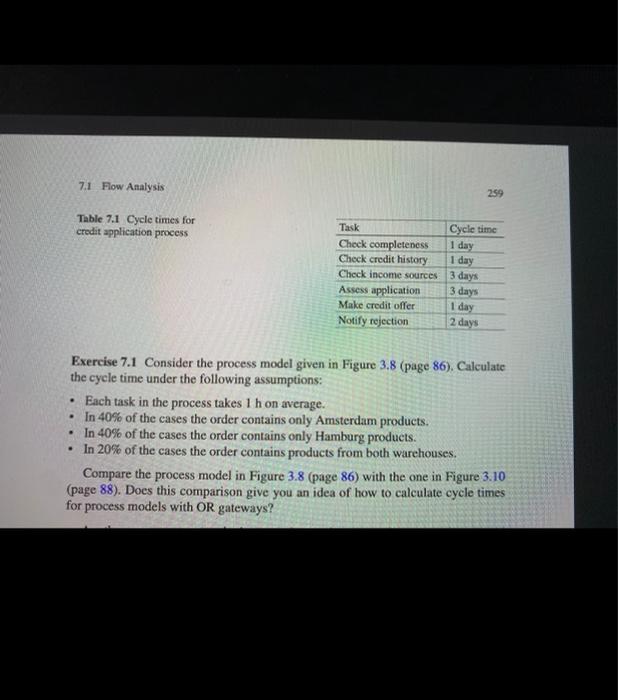
Question: 7.1 Flow Analysis 259 Table 7.1 Cycle times for credit application process Task Cycle time Check completeness 1 day Check credit history 1 day Check

7.1 Flow Analysis 259 Table 7.1 Cycle times for
7.1 Flow Analysis 259 Table 7.1 Cycle times for credit application process Task Cycle time Check completeness 1 day Check credit history 1 day Check income sources 3 days Assess application 3 days Make credit offer 1 day Notify rejection 2 days . Exercise 7.1 Consider the process model given in Figure 3.8 (page 86). Calculate the cycle time under the following assumptions: Each task in the process takes 1 h on average. In 40% of the cases the order contains only Amsterdam products. In 40% of the cases the order contains only Hamburg products. In 20% of the cases the order contains products from both warehouses. Compare the process model in Figure 3.8 (page 86) with the one in Figure 3.10 (page 88). Does this comparison give you an idea of how to calculate cycle times for process models with OR gateways? . Manager (the latter is the tool that we used to create the models in this book). An open-source alternative to these commercial tools is the process analytics platform Apromore. 12 order only contains Amsterdam products Forward sub order to Amsterdam warehouse order only.com Hamburg product Regar Check order line items Forward sub order to Hamburg warehouse Order received Oder completed order contains both Am and Hamburg products Forward sub order to Amsterdam warehouse Forward sub order to Hamburg warehouse Fig. 3.8 Modeling an inclusive decision: first trial 7.1 Flow Analysis 259 Table 7.1 Cycle times for credit application process Task Cycle time Check completeness 1 day Check credit history 1 day Check income sources 3 days Assess application 3 days Make credit offer 1 day Notify rejection 2 days . Exercise 7.1 Consider the process model given in Figure 3.8 (page 86). Calculate the cycle time under the following assumptions: Each task in the process takes 1 h on average. In 40% of the cases the order contains only Amsterdam products. In 40% of the cases the order contains only Hamburg products. In 20% of the cases the order contains products from both warehouses. Compare the process model in Figure 3.8 (page 86) with the one in Figure 3.10 (page 88). Does this comparison give you an idea of how to calculate cycle times for process models with OR gateways? . Manager (the latter is the tool that we used to create the models in this book). An open-source alternative to these commercial tools is the process analytics platform Apromore. 12 order only contains Amsterdam products Forward sub order to Amsterdam warehouse order only.com Hamburg product Regar Check order line items Forward sub order to Hamburg warehouse Order received Oder completed order contains both Am and Hamburg products Forward sub order to Amsterdam warehouse Forward sub order to Hamburg warehouse Fig. 3.8 Modeling an inclusive decision: first trial

Step by Step Solution

There are 3 Steps involved in it

1 Expert Approved Answer
Step: 1 Unlock blur-text-image
Question Has Been Solved by an Expert!

Get step-by-step solutions from verified subject matter experts

Step: 2 Unlock
Step: 3 Unlock

Students Have Also Explored These Related General Management Questions!