

Question: 7.2 Estimating a Population Mean. I want you to help me solve this question. it's a 2 part step to the question of answering the
7.2 Estimating a Population Mean. I want you to help me solve this question. it's a 2 part step to the question of answering the 2 questions, the question of help me solve this shows a step by step on how to do it all 2 part, I'm going to attach a photo of the question right below it. I also have a view an example to help on solving the question I will attach it below as well.
Here is the question.
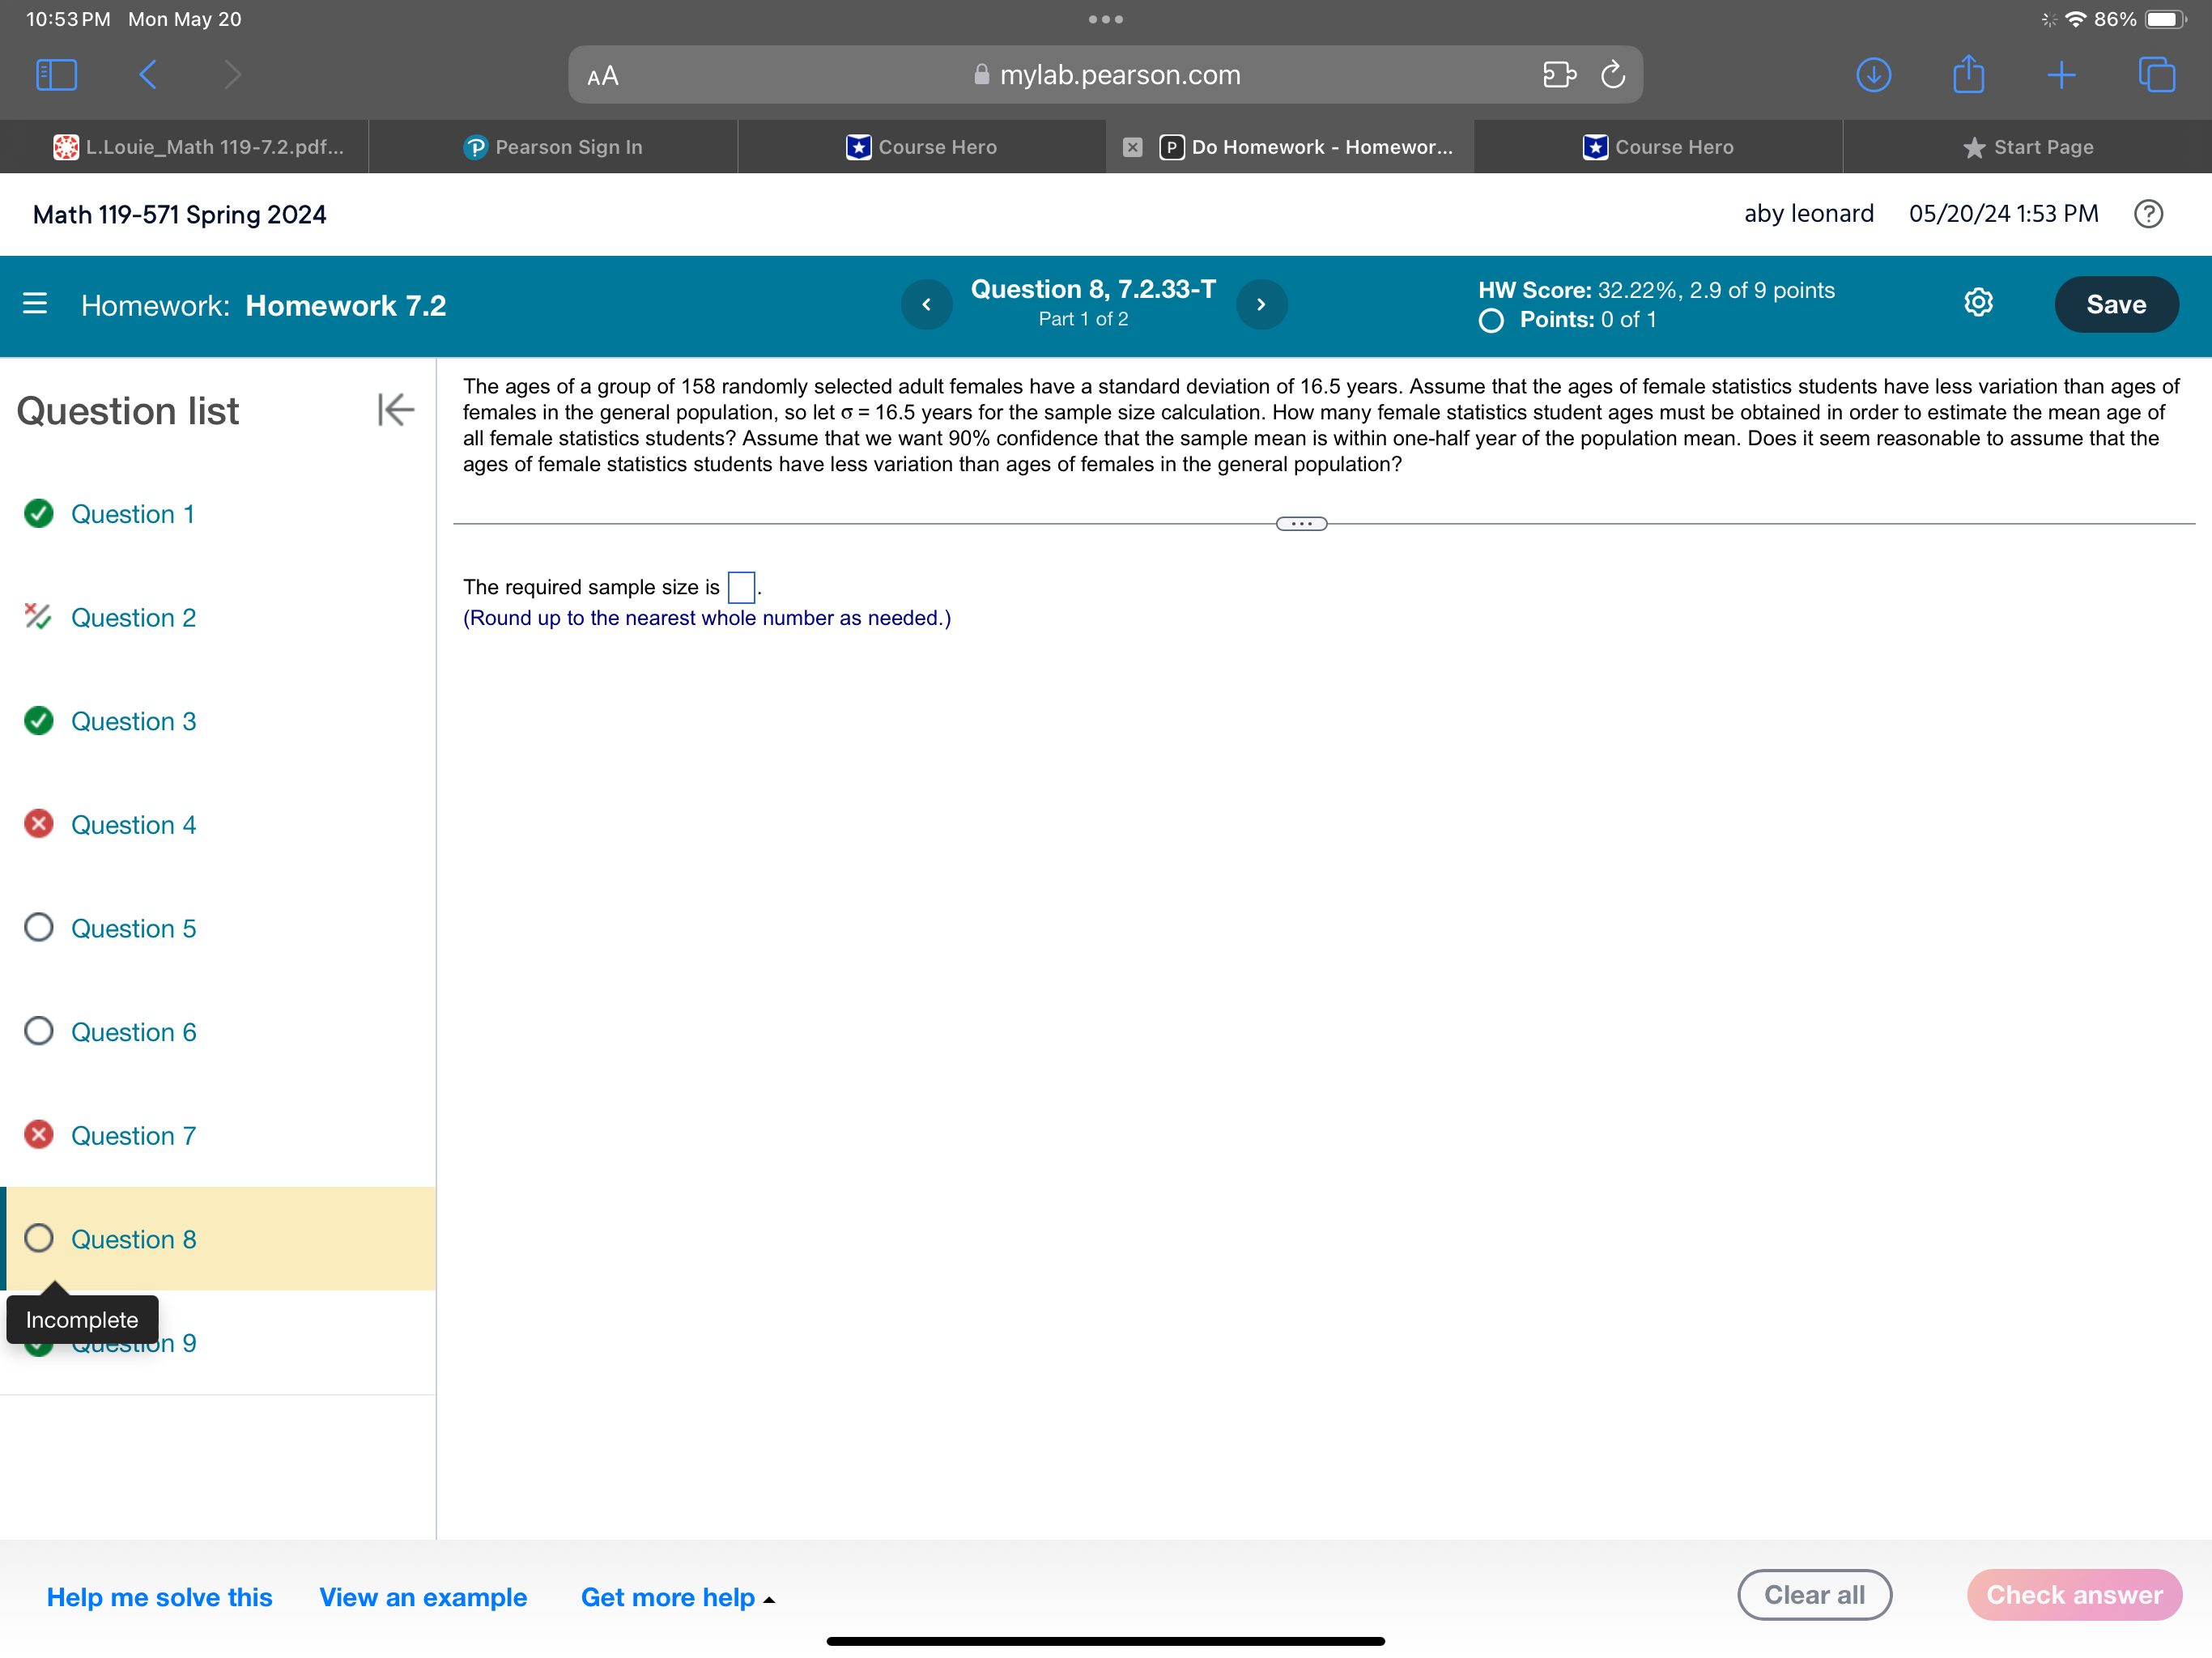
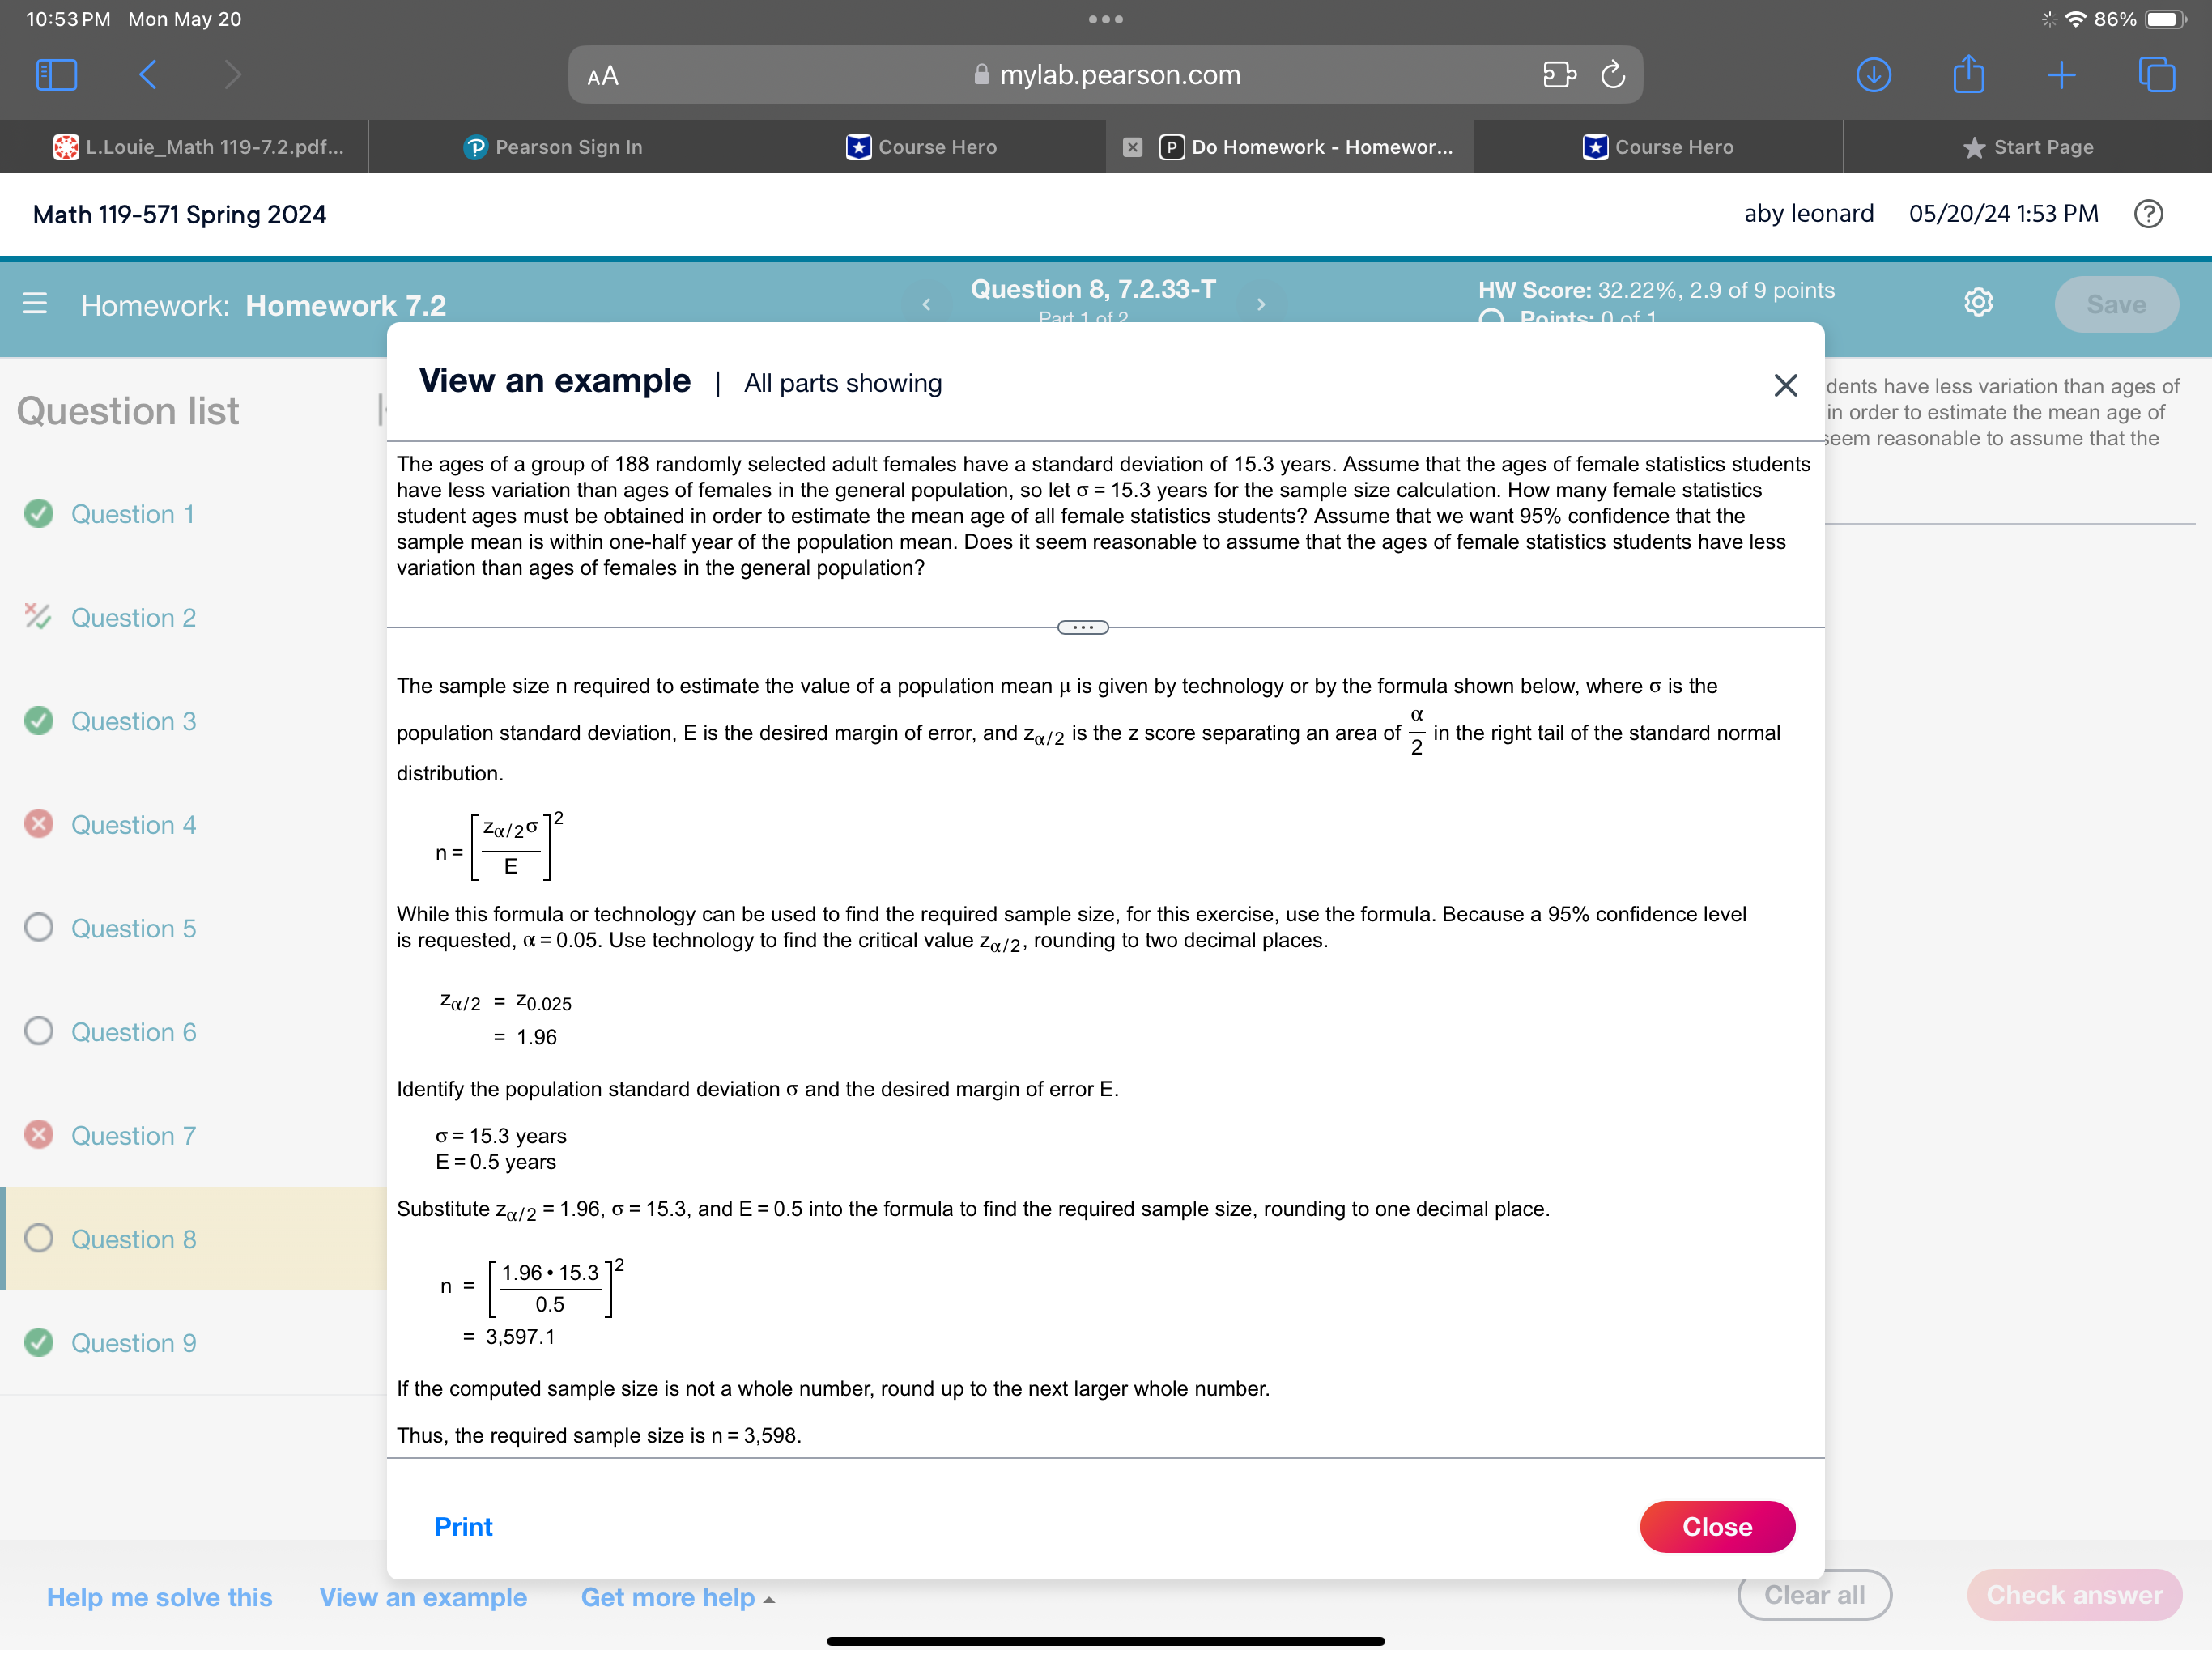
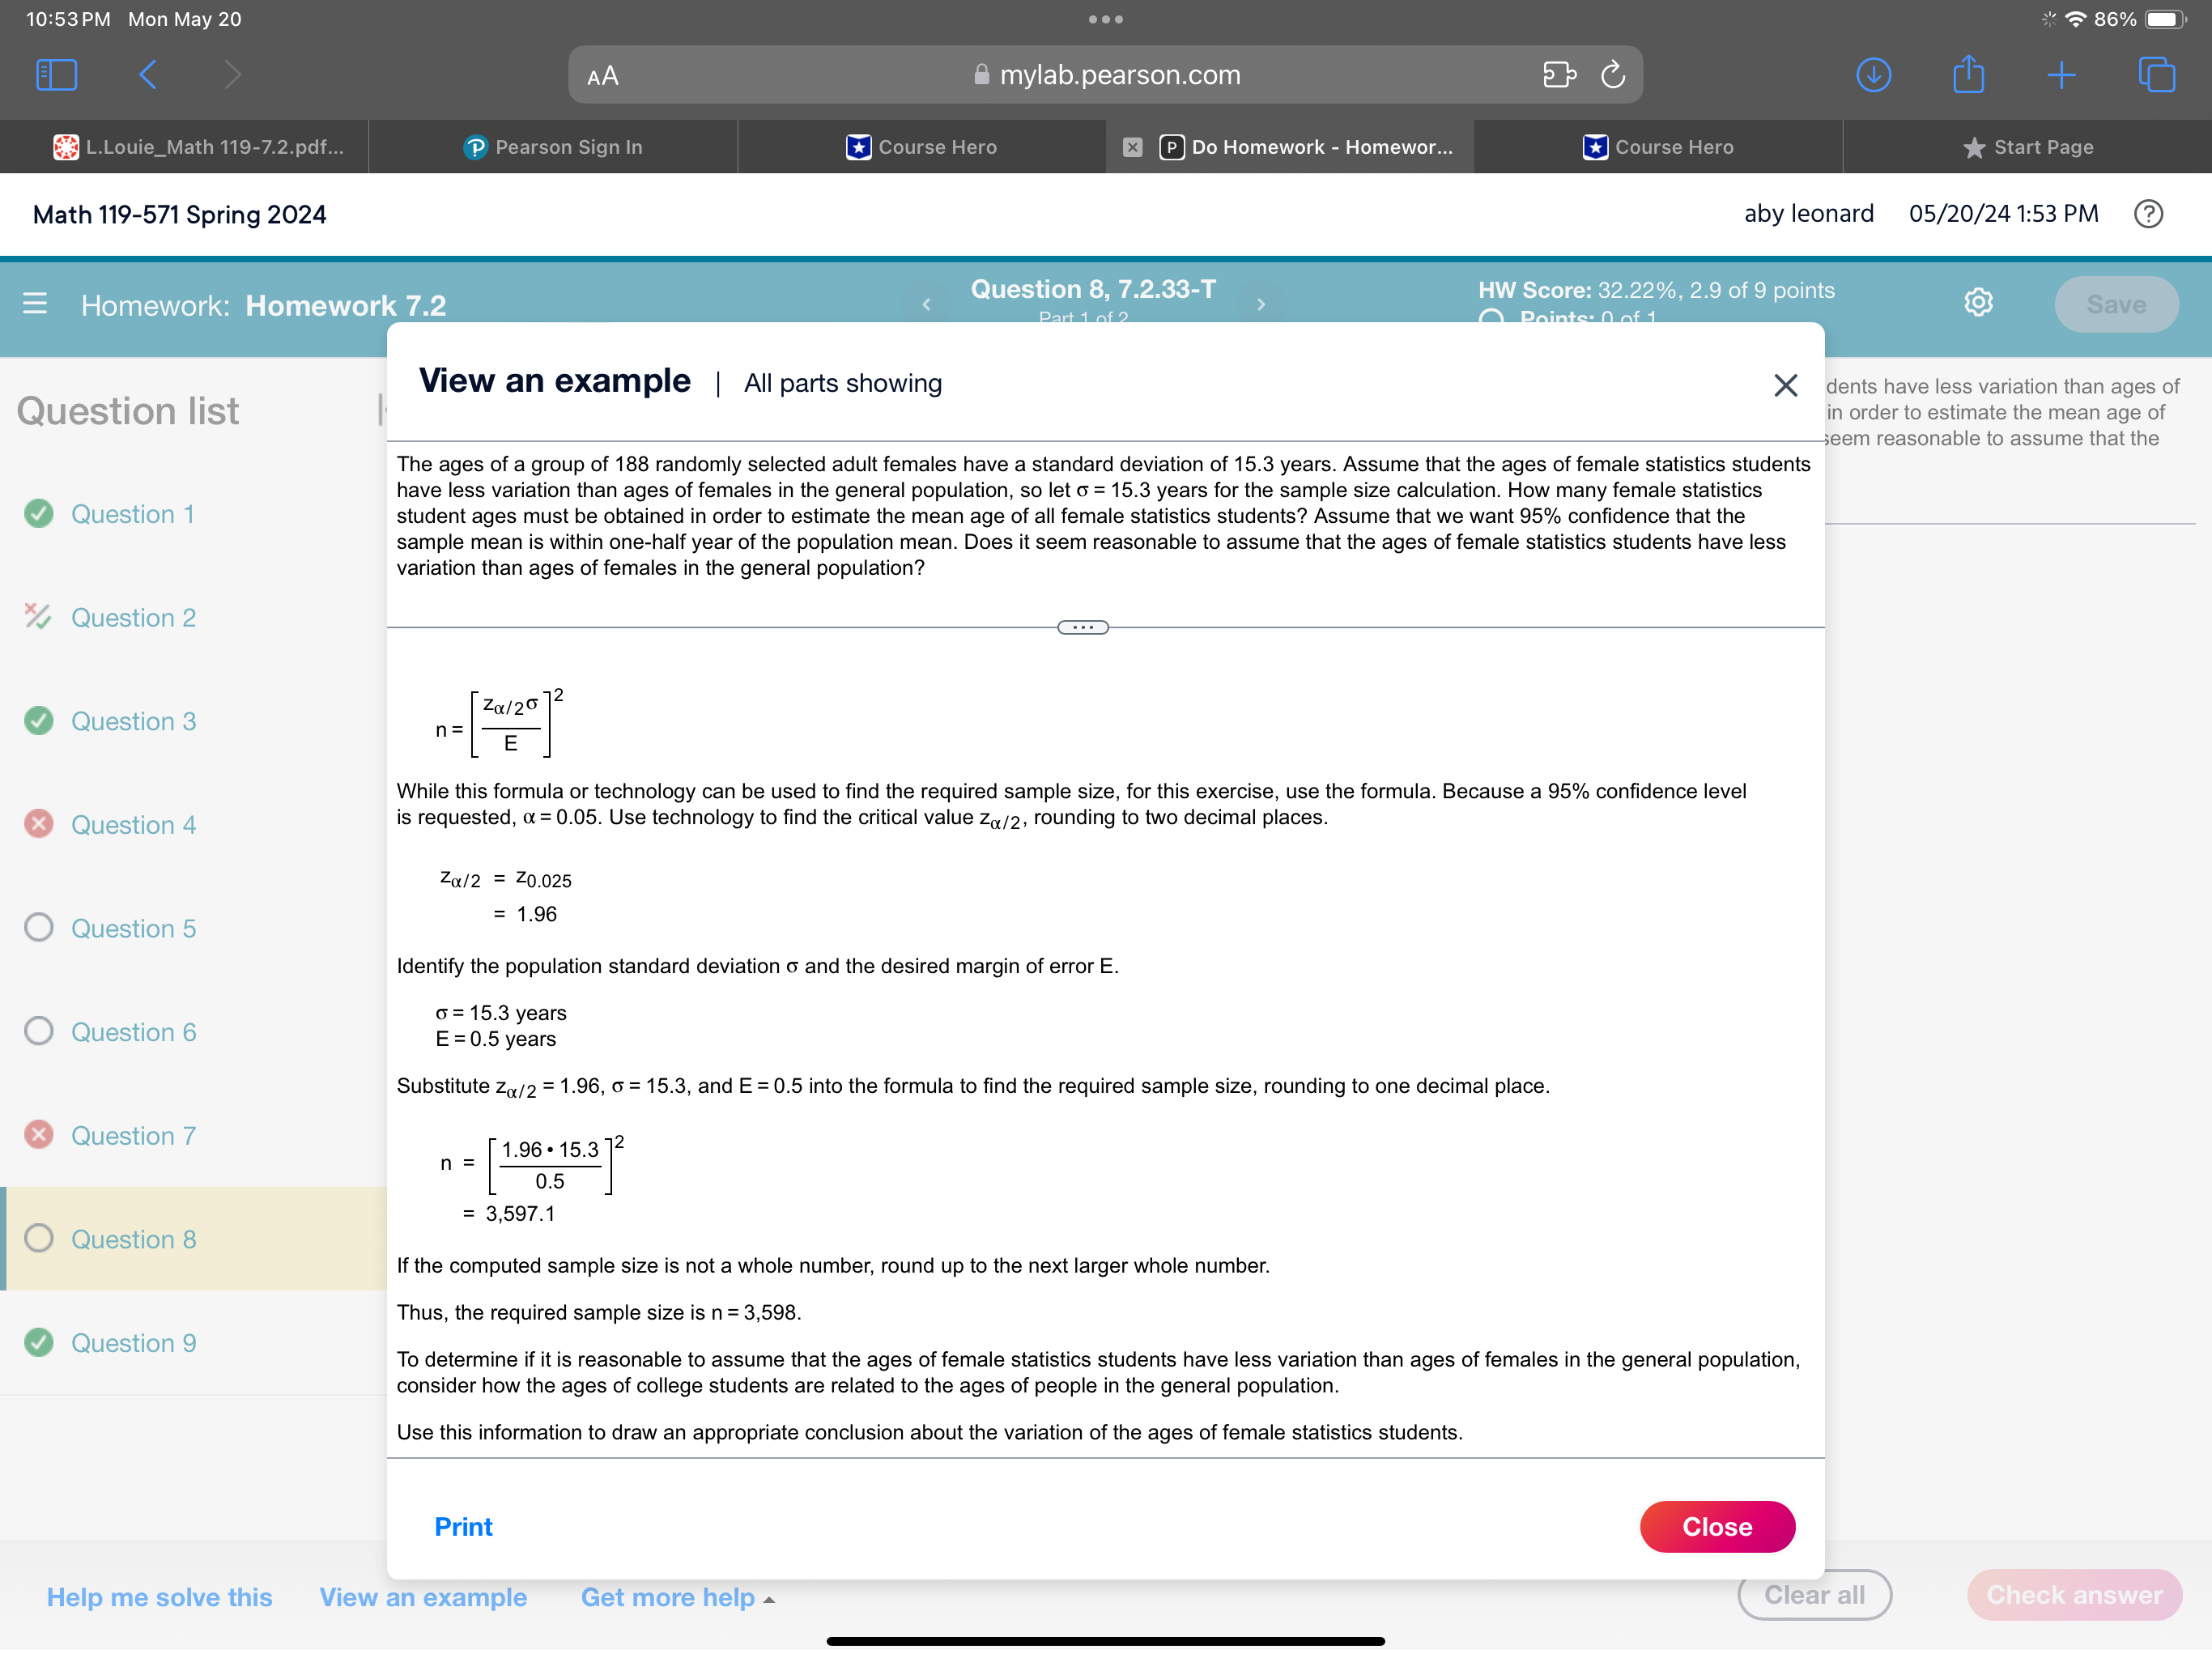
10:53PM Mon May 20 & mylab.pearson.com yuie_Math 119-7.2.p F [ > : ( ] @Do Homework - Homewor... Math 119-571 Spring 2024 aby leonard 05/20/241:53PM (3) Question 8, 7.2.33-T 3 HW Score: 32.22%, 2.9 of 9 points USR] QO Points: 0 of 1 Homework 7.2 . . The ages of a group of 158 randomly selected adult females have a standard deviation of 16.5 years. Assume that the ages of female statistics students have less variation than ages of Queshon ||St I females in the general population, so let 6 = 16.5 years for the sample size calculation. How many female statistics student ages must be obtained in order to estimate the mean age of all female statistics students? Assume that we want 90% confidence that the sample mean is within one-half year of the population mean. Does it seem reasonable to assume that the ages of female statistics students have less variation than ages of females in the general population? @ CQuestion 1 The required sample size is | |. Question 2 (Round up to the nearest whole number as needed.) X @ Question 3 Question 4 O Question 5 O Question 6 Question 7 O Question 8 Incomplete T n 9 Help me solve this View an example Get more help 10:53PM Mon May 20 & mylab.pearson.com Math 119-571 Spring 2024 @ Do Homework - Homewor... aby leonard 05/20/241:53PM (3) - . ] Homework: Homework 7.2 3 7.2.33-T o 2.22%, 2.9 of 9 points @ @ Question list @ Question 1 % Question 2 View an example | All parts showing X dents have less variation than ages of in order to estimate the mean age of seem reasonable to assume that the The ages of a group of 188 randomly selected adult females have a standard deviation of 15.3 years. Assume that the ages of female statistics students have less variation than ages of females in the general population, so let = 15.3 years for the sample size calculation. How many female statistics student ages must be obtained in order to estimate the mean age of all female statistics students? Assume that we want 95% confidence that the sample mean is within one-half year of the population mean. Does it seem reasonable to assume that the ages of female statistics students have less variation than ages of females in the general population? The sample size n required to estimate the value of a population mean p is given by technology or by the formula shown below, where is the o 0 Question 3 population standard deviation, E is the desired margin of error, and z, is the z score separating an area of 2 in the right tail of the standard normal distribution. Question 4 /20 ]? n=| O Q t 5 While this formula or technology can be used to find the required sample size, for this exercise, use the formula. Because a 95% confidence level Sestol is requested, a=0.05. Use technology to find the critical value zy2, rounding to two decimal places. Zg/2 = 20.025 O Question 6 =1.96 Identify the population standard deviation and the desired margin of error E. 0 Question 7 6=15.3 years E=0.5years Substitute /2 = 1.96, 6 = 15.3, and E = 0.5 into the formula to find the required sample size, rounding to one decimal place. O Question 8 _[196-1537 0.5 @ CQuestion 9 = 3,597.1 If the computed sample size is not a whole number, round up to the next larger whole number. Thus, the required sample size is n = 3,598. Help me solve this View an example Get more help ~ ("Clea 10:53PM Mon May 20 & mylab.pearson.com @ Do Homework - Homewor... Math 119-571 Spring 2024 aby leonard 05/20/241:53PM (3) . T = ) Homework: Homework 7.2 3 R = B @ i i View an example | All parts showing X dents have less variation than ages of Questlon list | in order to estimate the mean age of seem reasonable to assume that the The ages of a group of 188 randomly selected adult females have a standard deviation of 15.3 years. Assume that the ages of female statistics students have less variation than ages of females in the general population, so let = 15.3 years for the sample size calculation. How many female statistics 0 Question 1 student ages must be obtained in order to estimate the mean age of all female statistics students? Assume that we want 95% confidence that the sample mean is within one-half year of the population mean. Does it seem reasonable to assume that the ages of female statistics students have less variation than ages of females in the general population? % Question 2 2 Zq/20 @ Question 3 n= - E While this formula or technology can be used to find the required sample size, for this exercise, use the formula. Because a 95% confidence level o Question 4 is requested, a=0.05. Use technology to find the critical value z/2, rounding to two decimal places. Zg/2 = 20.025 = 1.96 O Question 5 Identify the population standard deviation and the desired margin of error E. 6=15.3 years O Question 6 E=0.5 years Substitute z,/2 =1.96, 6 = 15.3, and E = 0.5 into the formula to find the required sample size, rounding to one decimal place. 0 Question 7 " e 1.96-15.3 12 0.5 = 3,597.1 O Question 8 If the computed sample size is not a whole number, round up to the next larger whole number. Thus, the required sample size is n=3,598. @ Question 9 o - - . ) To determine if it is reasonable to assume that the ages of female statistics students have less variation than ages of females in the general population, consider how the ages of college students are related to the ages of people in the general population. Use this information to draw an appropriate conclusion about the variation of the ages of female statistics students. Help me solve this View an example Get more help ~ ("Clea
Step by Step Solution
There are 3 Steps involved in it

Get step-by-step solutions from verified subject matter experts