

Question: 7664 Data Set instructions The 7864 data set is fictional data. The data represents a teacher's recording of student demographics and academic performance across
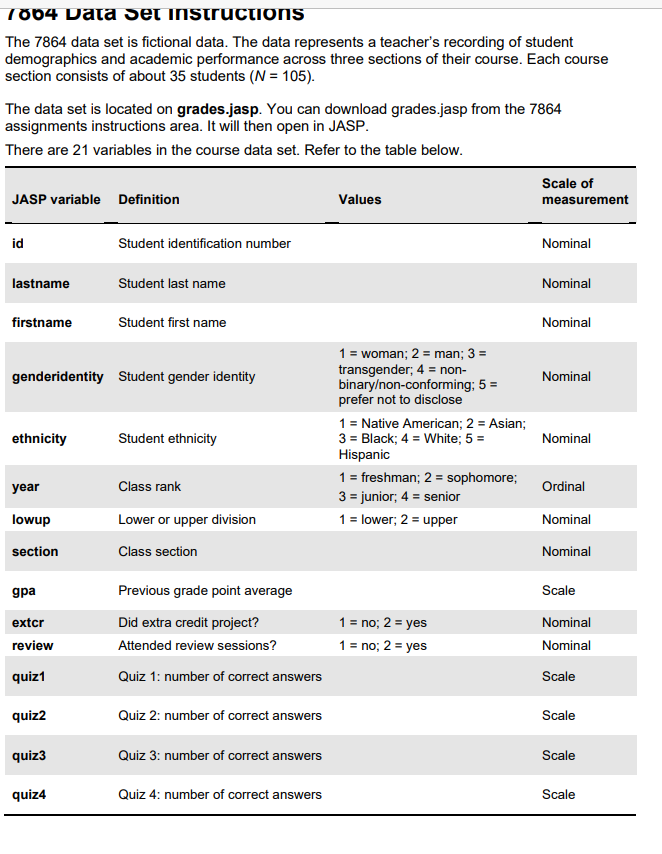
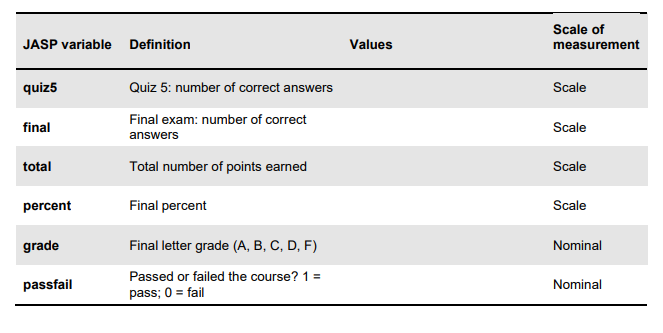
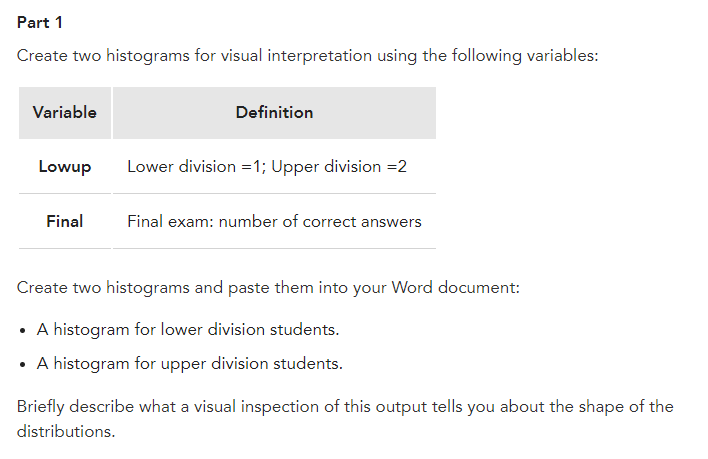
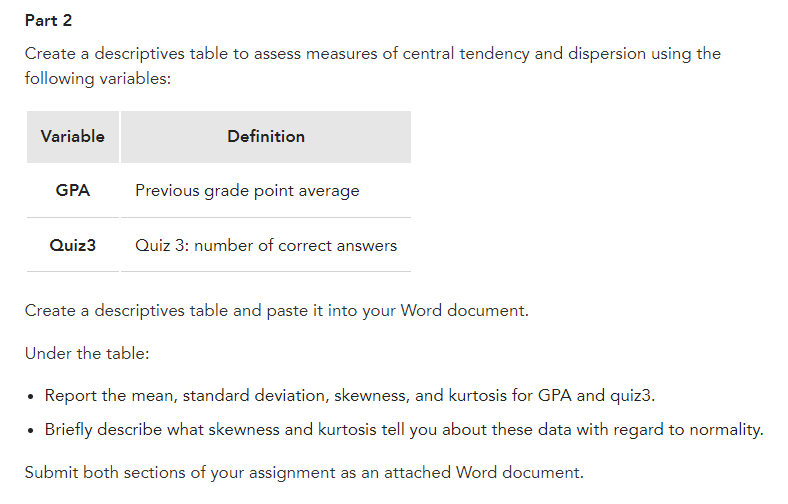
7664 Data Set instructions The 7864 data set is fictional data. The data represents a teacher's recording of student demographics and academic performance across three sections of their course. Each course section consists of about 35 students (N = 105). The data set is located on grades.jasp. You can download grades.jasp from the 7864 assignments instructions area. It will then open in JASP. There are 21 variables in the course data set. Refer to the table below. JASP variable Definition Values Scale of measurement id Student identification number lastname Student last name firstname Student first name Nominal Nominal Nominal 1 = woman; 2 = man; 3 = transgender; 4 = non- genderidentity Student gender identity Nominal binary/non-conforming; 5 = prefer not to disclose ethnicity Student ethnicity 1 = Native American; 2 = Asian; 3 = Black; 4 = White; 5 = Nominal Hispanic 1 = freshman; 2 = sophomore; year Class rank Ordinal 3 = junior; 4 = senior lowup Lower or upper division 1 = lower; 2 = upper Nominal section Class section Nominal gpa Previous grade point average Scale extcr Did extra credit project? 1 = no; 2 = yes Nominal review Attended review sessions? 1 = no; 2 = yes Nominal quiz1 Quiz 1: number of correct answers Scale quiz2 Quiz 2: number of correct answers Scale quiz3 Quiz 3: number of correct answers Scale quiz4 Quiz 4: number of correct answers Scale JASP variable Definition Values Scale of measurement quiz5 Quiz 5: number of correct answers Scale final Final exam: number of correct answers Scale total Total number of points earned Scale percent Final percent Scale grade Final letter grade (A, B, C, D, F) Nominal Passed or failed the course? 1 = passfail Nominal pass; 0 = fail Part 1 Create two histograms for visual interpretation using the following variables: Variable Definition Lowup Lower division =1; Upper division =2 Final Final exam: number of correct answers Create two histograms and paste them into your Word document: A histogram for lower division students. A histogram for upper division students. Briefly describe what a visual inspection of this output tells you about the shape of the distributions. Part 2 Create a descriptives table to assess measures of central tendency and dispersion using the following variables: Variable Definition GPA Previous grade point average Quiz3 Quiz 3: number of correct answers Create a descriptives table and paste it into your Word document. Under the table: Report the mean, standard deviation, skewness, and kurtosis for GPA and quiz3. Briefly describe what skewness and kurtosis tell you about these data with regard to normality. Submit both sections of your assignment as an attached Word document.
Step by Step Solution
There are 3 Steps involved in it

Get step-by-step solutions from verified subject matter experts