

Question: 8. (10 points) Below is a bifurcation diagram based on numerical simulations done by Ryu and Ko (2018) where X represents an animal population
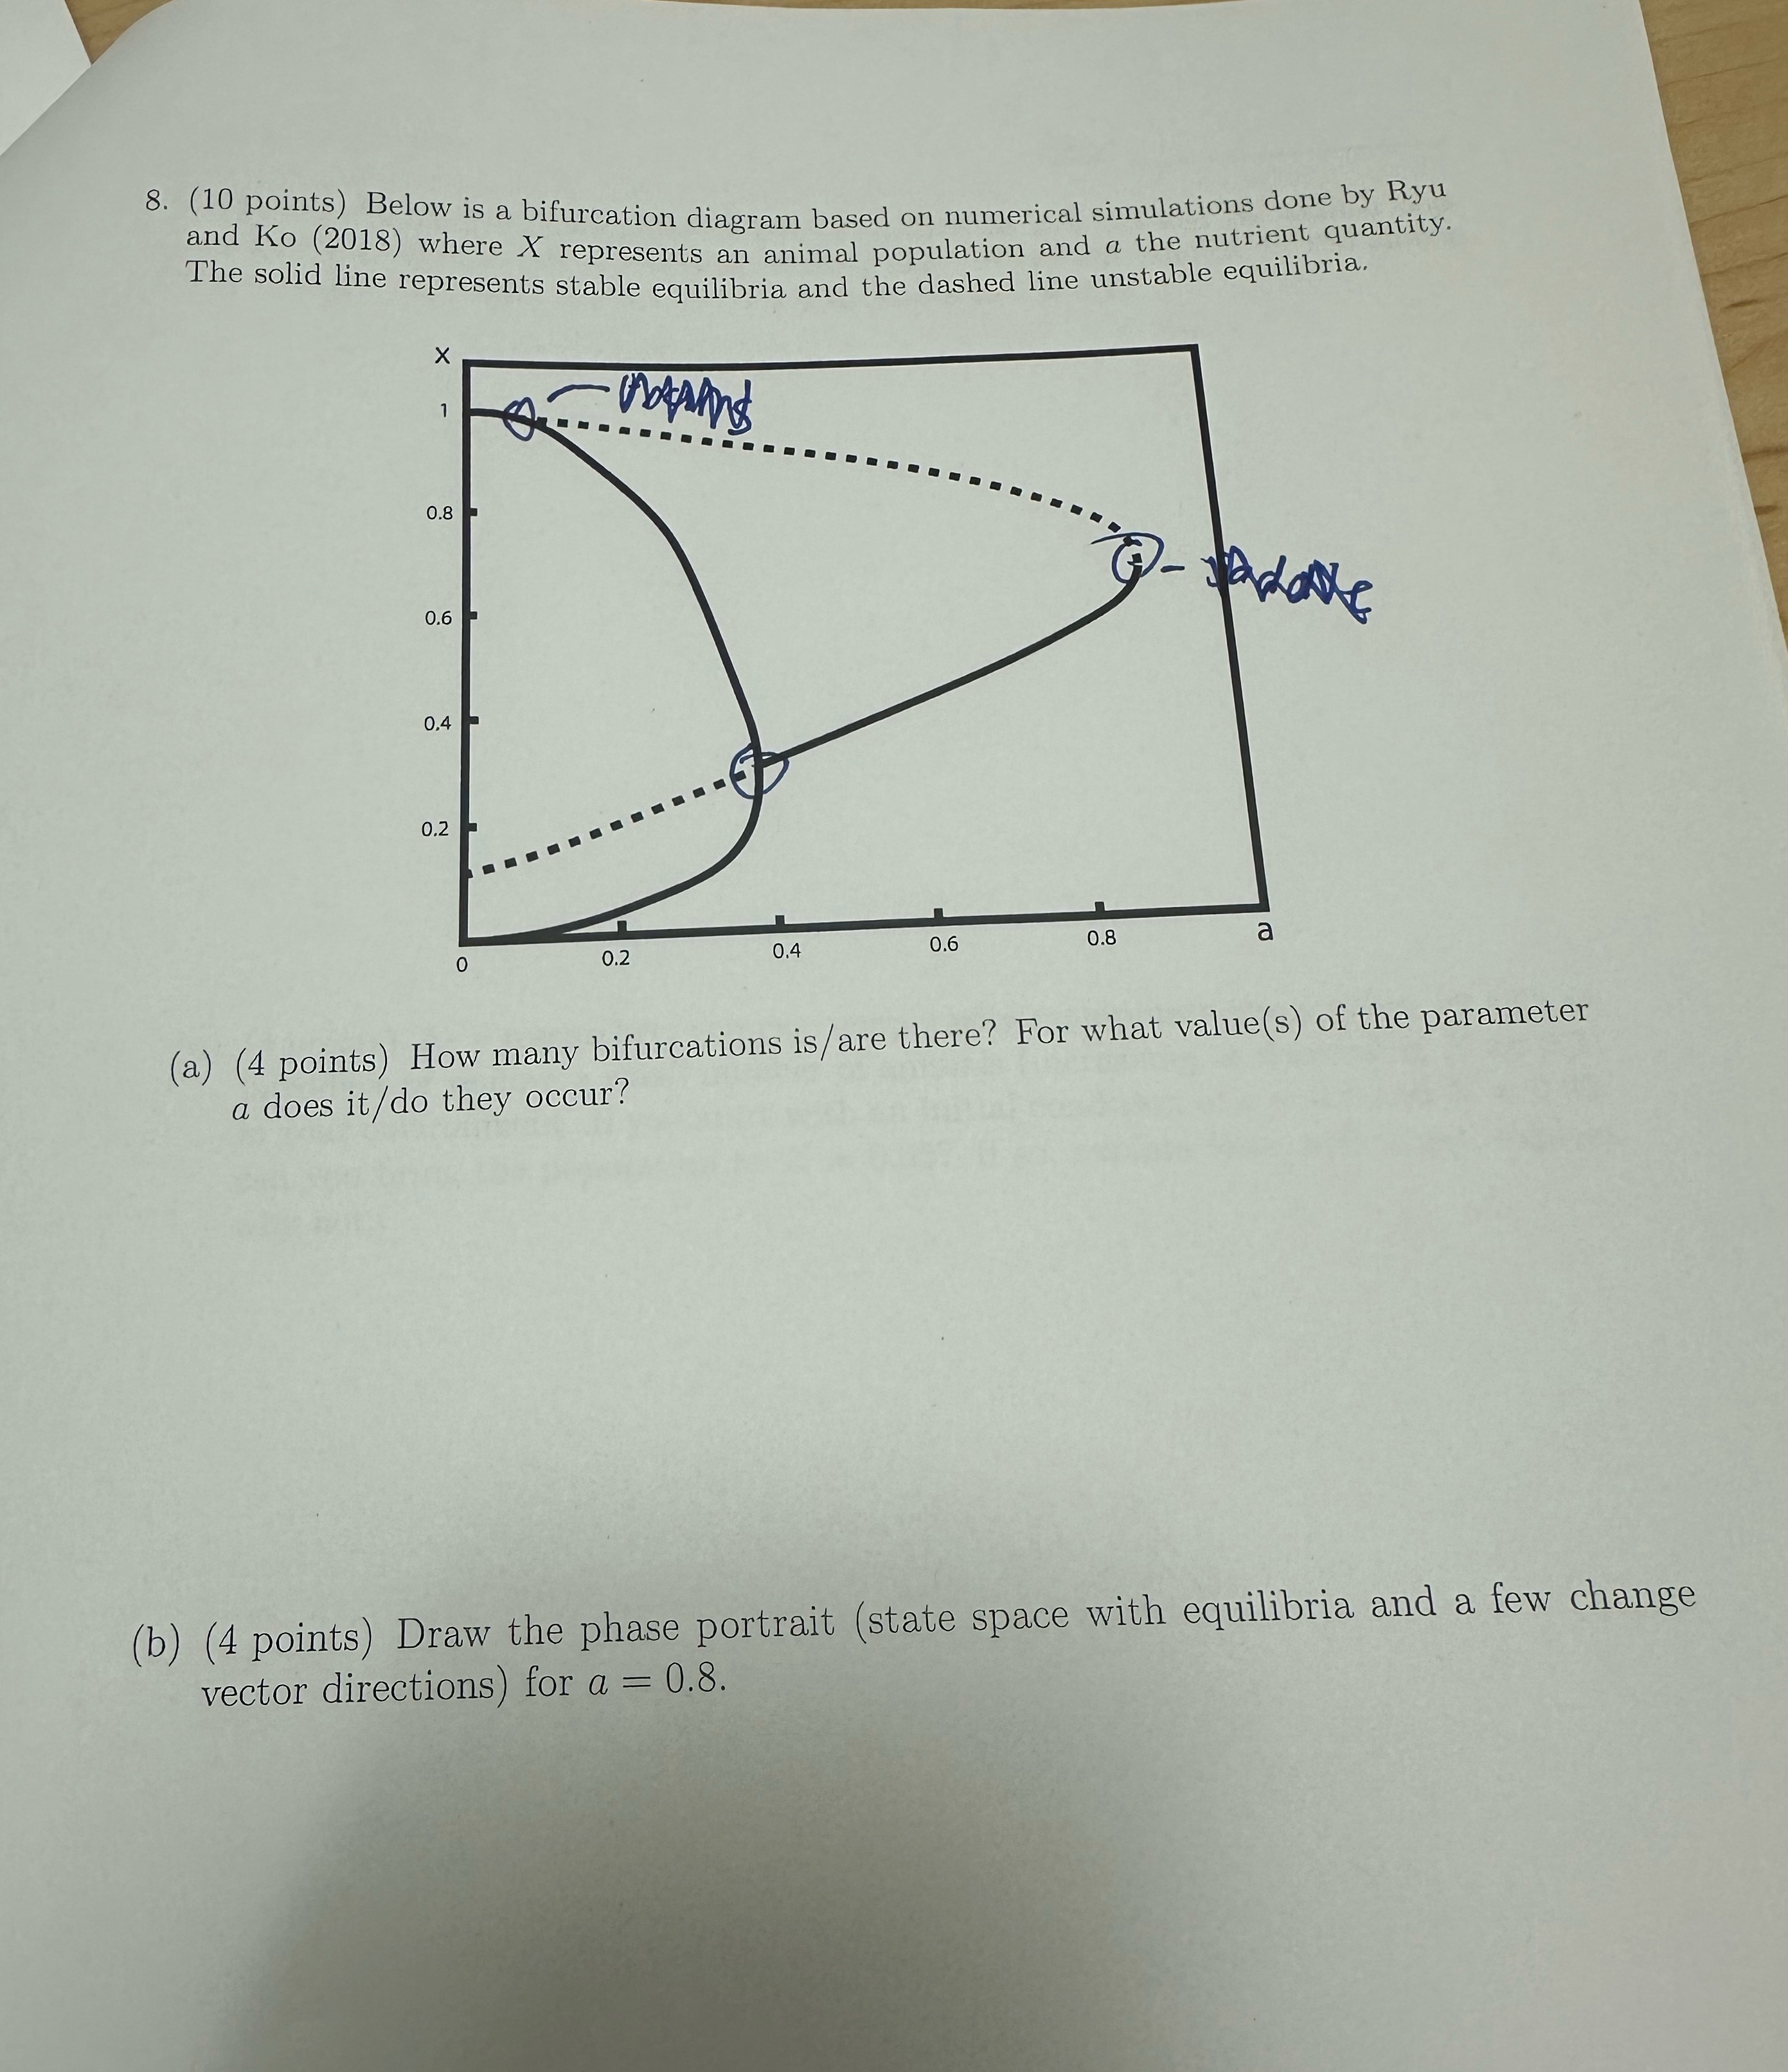
8. (10 points) Below is a bifurcation diagram based on numerical simulations done by Ryu and Ko (2018) where X represents an animal population and a the nutrient quantity. The solid line represents stable equilibria and the dashed line unstable equilibria. Mains X 1 0.8 0.6 0,4 0.2 0 - U 0.2 0.4 0.6 0.8 adate a (a) (4 points) How many bifurcations is/are there? For what value(s) of the parameter a does it/do they occur? (b) (4 points) Draw the phase portrait (state space with equilibria and a few change vector directions) for a = 0.8.
Step by Step Solution
There are 3 Steps involved in it
1 Expert Approved Answer
Step: 1 Unlock

Question Has Been Solved by an Expert!
Get step-by-step solutions from verified subject matter experts
Step: 2 Unlock
Step: 3 Unlock