

Question: Exercise D. Below is a bifurcation diagram adapted from Ryu and Ko (2018) where X represents an animal population and a is a. certain nutrient
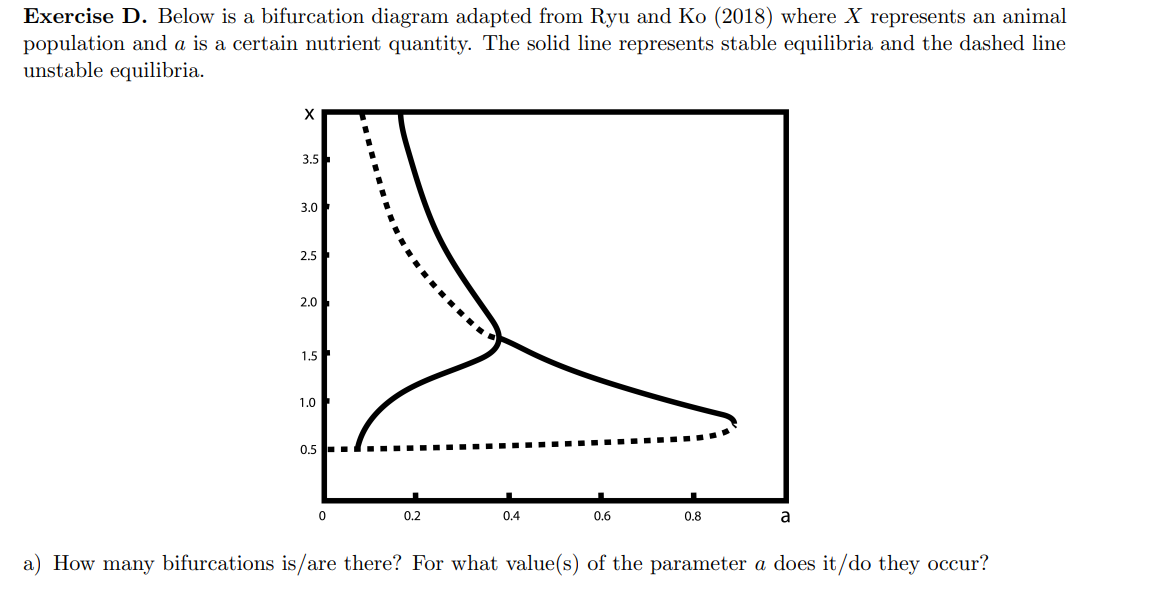
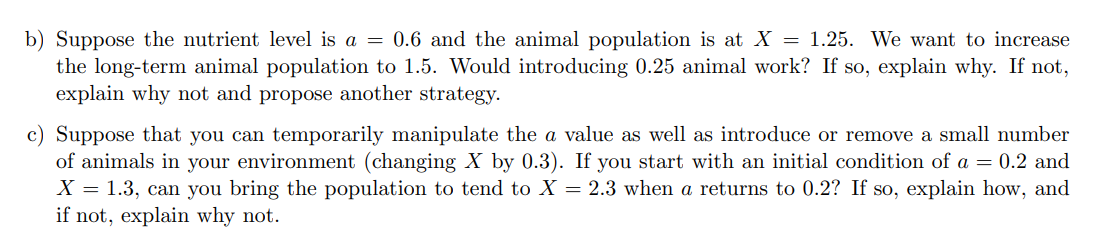
Exercise D. Below is a bifurcation diagram adapted from Ryu and Ko (2018) where X represents an animal population and a is a. certain nutrient quantity. The solid line represents stable equilibria and the dashed line unstable equilibria. 0 0.2 0.4 0.6 0.8 a a) How many bifurcations is/ are there? For what value(s) of the parameter a. does it / do they occur? 1)) Suppose the nutrient level is a = 0.6 and the animal population is at X = 1.25. We want to increase the long-term animal population to 1.5. Would introducing 0.25 animal work? If so, explain why. If not, explain why not and propose another strategy. c) Suppose that you can temporarily manipulate the a. value as well as introduce or remove a small number of animals in your environment (changing X by 0.3). If you start with an initial condition of a = 0.2 and X = 1.3, can you bring the population to tend to X = 2.3 when it returns to 0.2? If so, explain how, and if not, explain why not
Step by Step Solution
There are 3 Steps involved in it

Get step-by-step solutions from verified subject matter experts