

Question: 8. (10 pts) Consider the graph of the piecewise function y = f (x) pictured below. 75 -3 -2 -1 2 4 5 -2 (a)
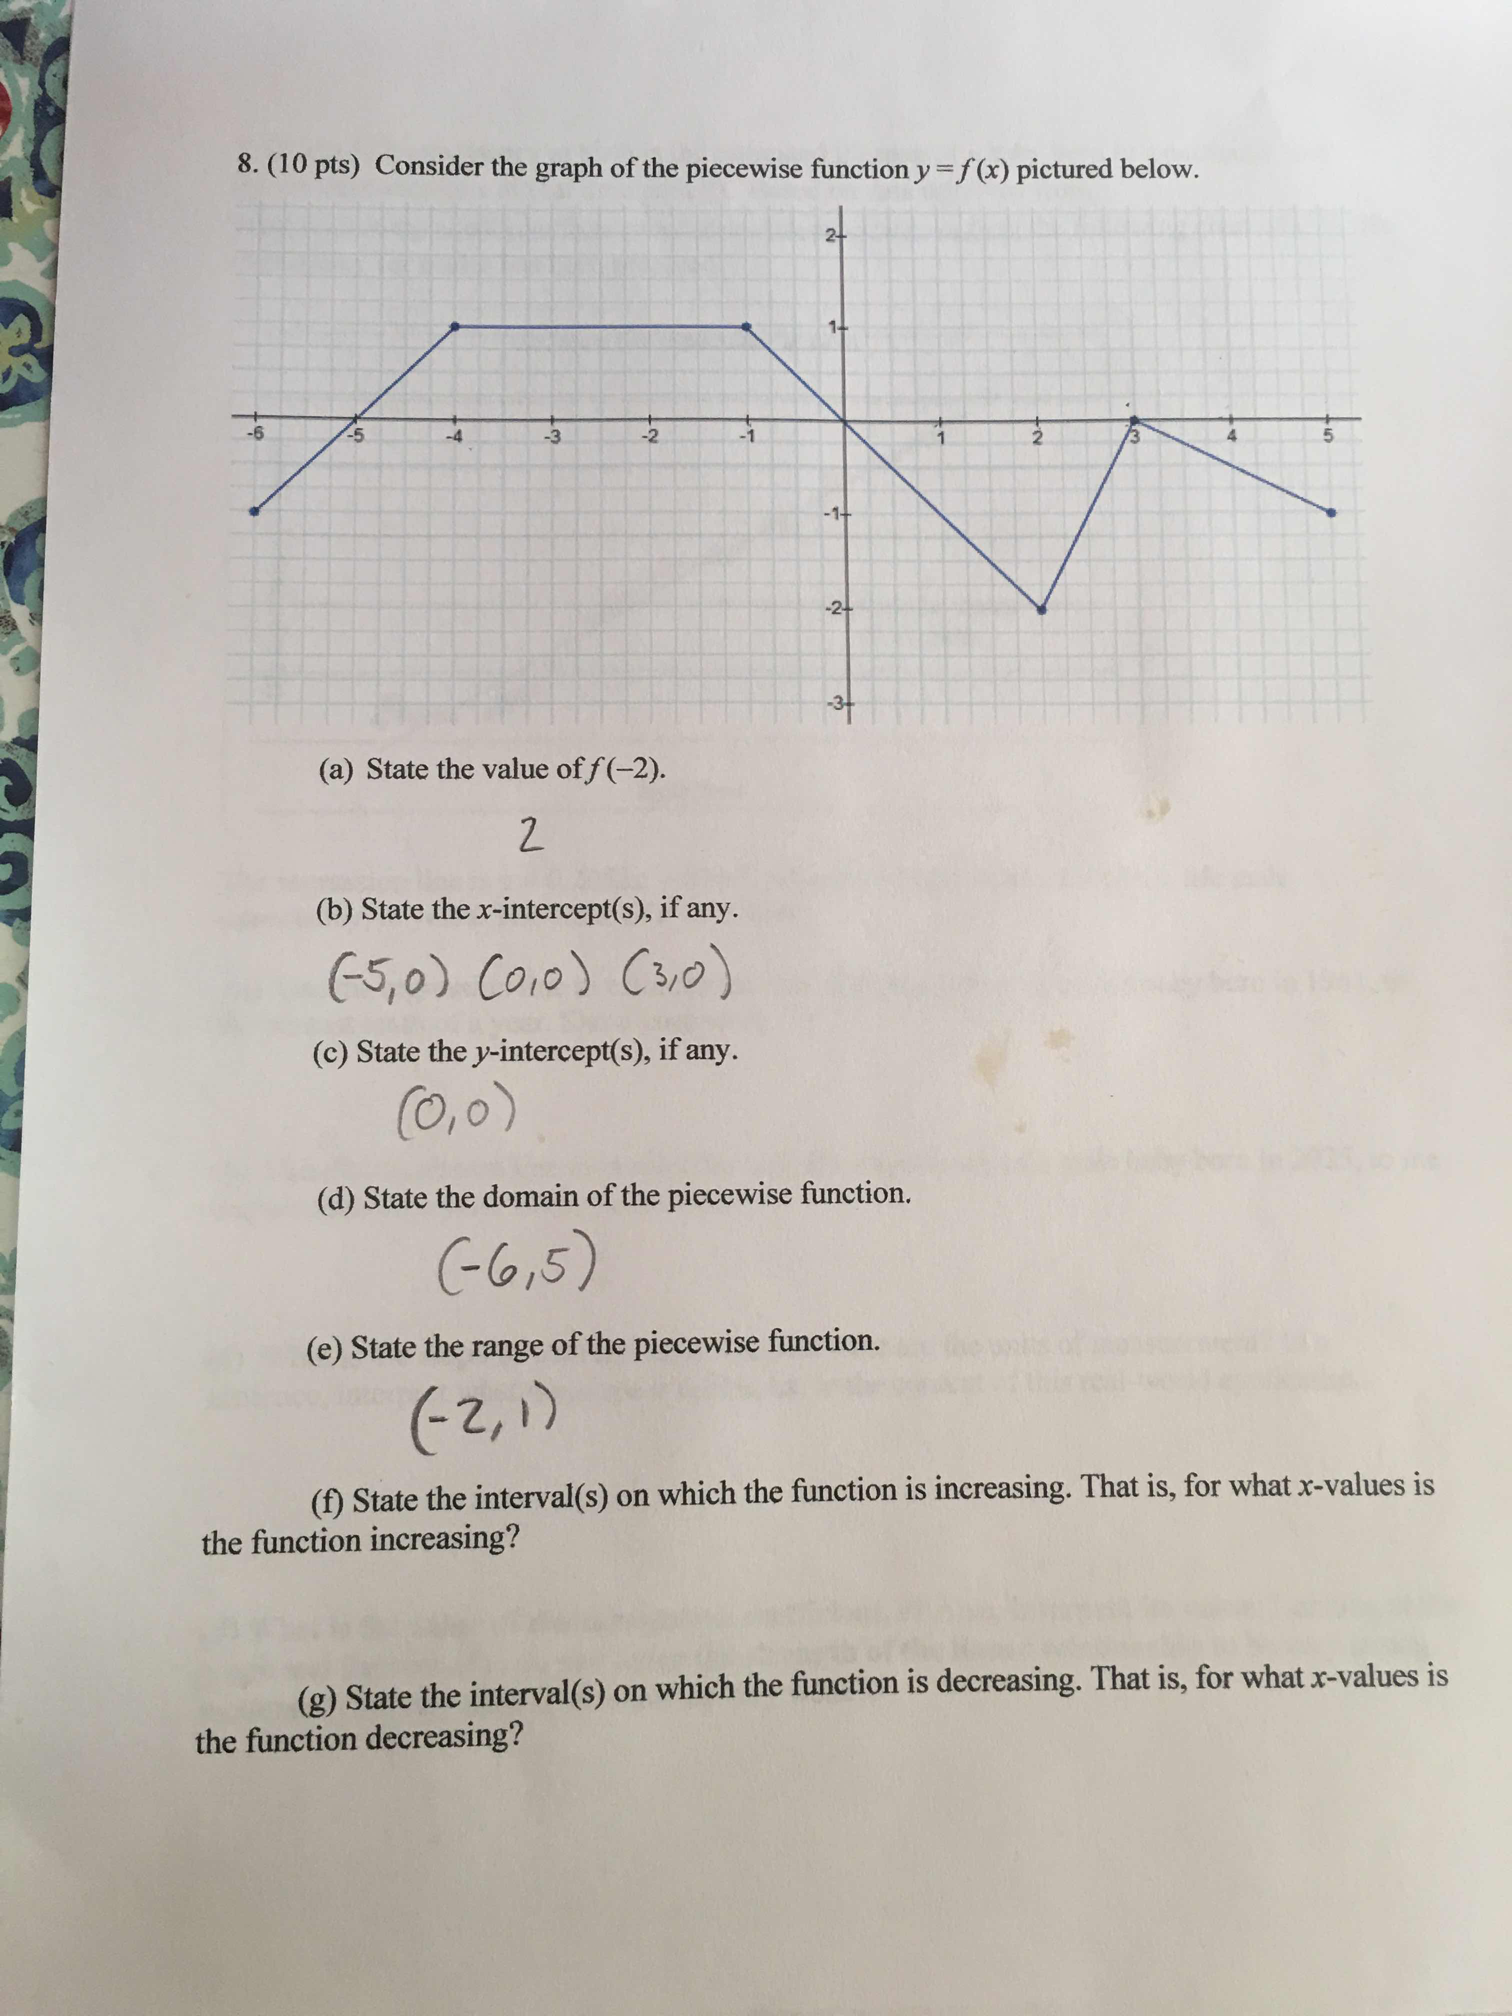
8. (10 pts) Consider the graph of the piecewise function y = f (x) pictured below. 75 -3 -2 -1 2 4 5 -2 (a) State the value of f(-2). 2 (b) State the x-intercept(s), if any. (- 5, 0 ) (010 ) ( 310) (c) State the y-intercept(s), if any. (010 ) (d) State the domain of the piecewise function. (- 6, 5 ) (e) State the range of the piecewise function. ( - 2 , 1 ) (f) State the interval(s) on which the function is increasing. That is, for what x-values is the function increasing? (g) State the interval(s) on which the function is decreasing. That is, for what x-values is the function decreasing
Step by Step Solution
There are 3 Steps involved in it
1 Expert Approved Answer
Step: 1 Unlock

Question Has Been Solved by an Expert!
Get step-by-step solutions from verified subject matter experts
Step: 2 Unlock
Step: 3 Unlock