

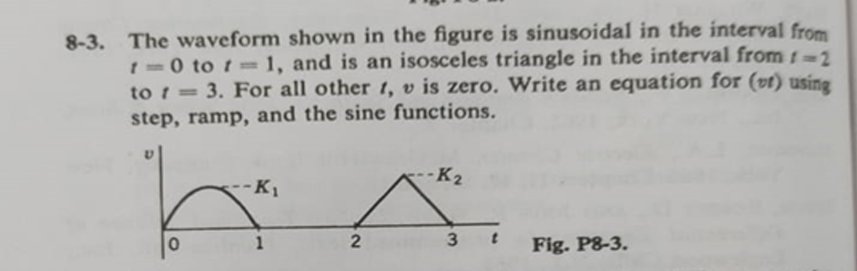
Question: 8 - 3 . The waveform shown in the figure is sinusoidal in the interval from ( t = 0 ) to
The waveform shown in the figure is sinusoidal in the interval from t to t and is an isosceles triangle in the interval from t to t For all other t v is zero. Write an equation for v t using step, ramp, and the sine functions.
P
Step by Step Solution
There are 3 Steps involved in it
1 Expert Approved Answer
Step: 1 Unlock

Question Has Been Solved by an Expert!
Get step-by-step solutions from verified subject matter experts
Step: 2 Unlock
Step: 3 Unlock