

Question: 8. (6 points) Below, the graph on the left shows the short-run cost curves for a firm in a perfectly competitive market, and the graph
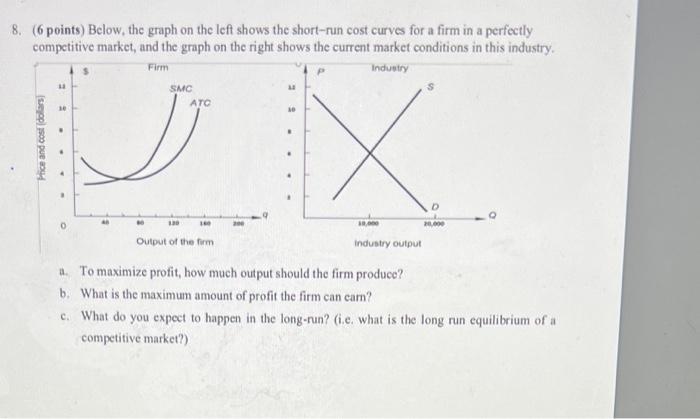
8. (6 points) Below, the graph on the left shows the short-run cost curves for a firm in a perfectly competitive market, and the graph on the right shows the current market conditions in this industry. Firm Industry Price and cost (dollars) = 11 2 SMC ATC 160 Output of the firm 14 10 20,000 industry output a. To maximize profit, how much output should the firm produce? b. What is the maximum amount of profit the firm can earn? c. What do you expect to happen in the long-run? (i.e. what is the long run equilibrium of a competitive market?) 8. (6 points) Below, the graph on the left shows the short-run cost curves for a firm in a perfectly competitive market, and the graph on the right shows the current market conditions in this industry. Firm Industry Price and cost (dollars) = 11 2 SMC ATC 160 Output of the firm 14 10 20,000 industry output a. To maximize profit, how much output should the firm produce? b. What is the maximum amount of profit the firm can earn? c. What do you expect to happen in the long-run? (i.e. what is the long run equilibrium of a competitive market?)
Step by Step Solution
There are 3 Steps involved in it

Get step-by-step solutions from verified subject matter experts