

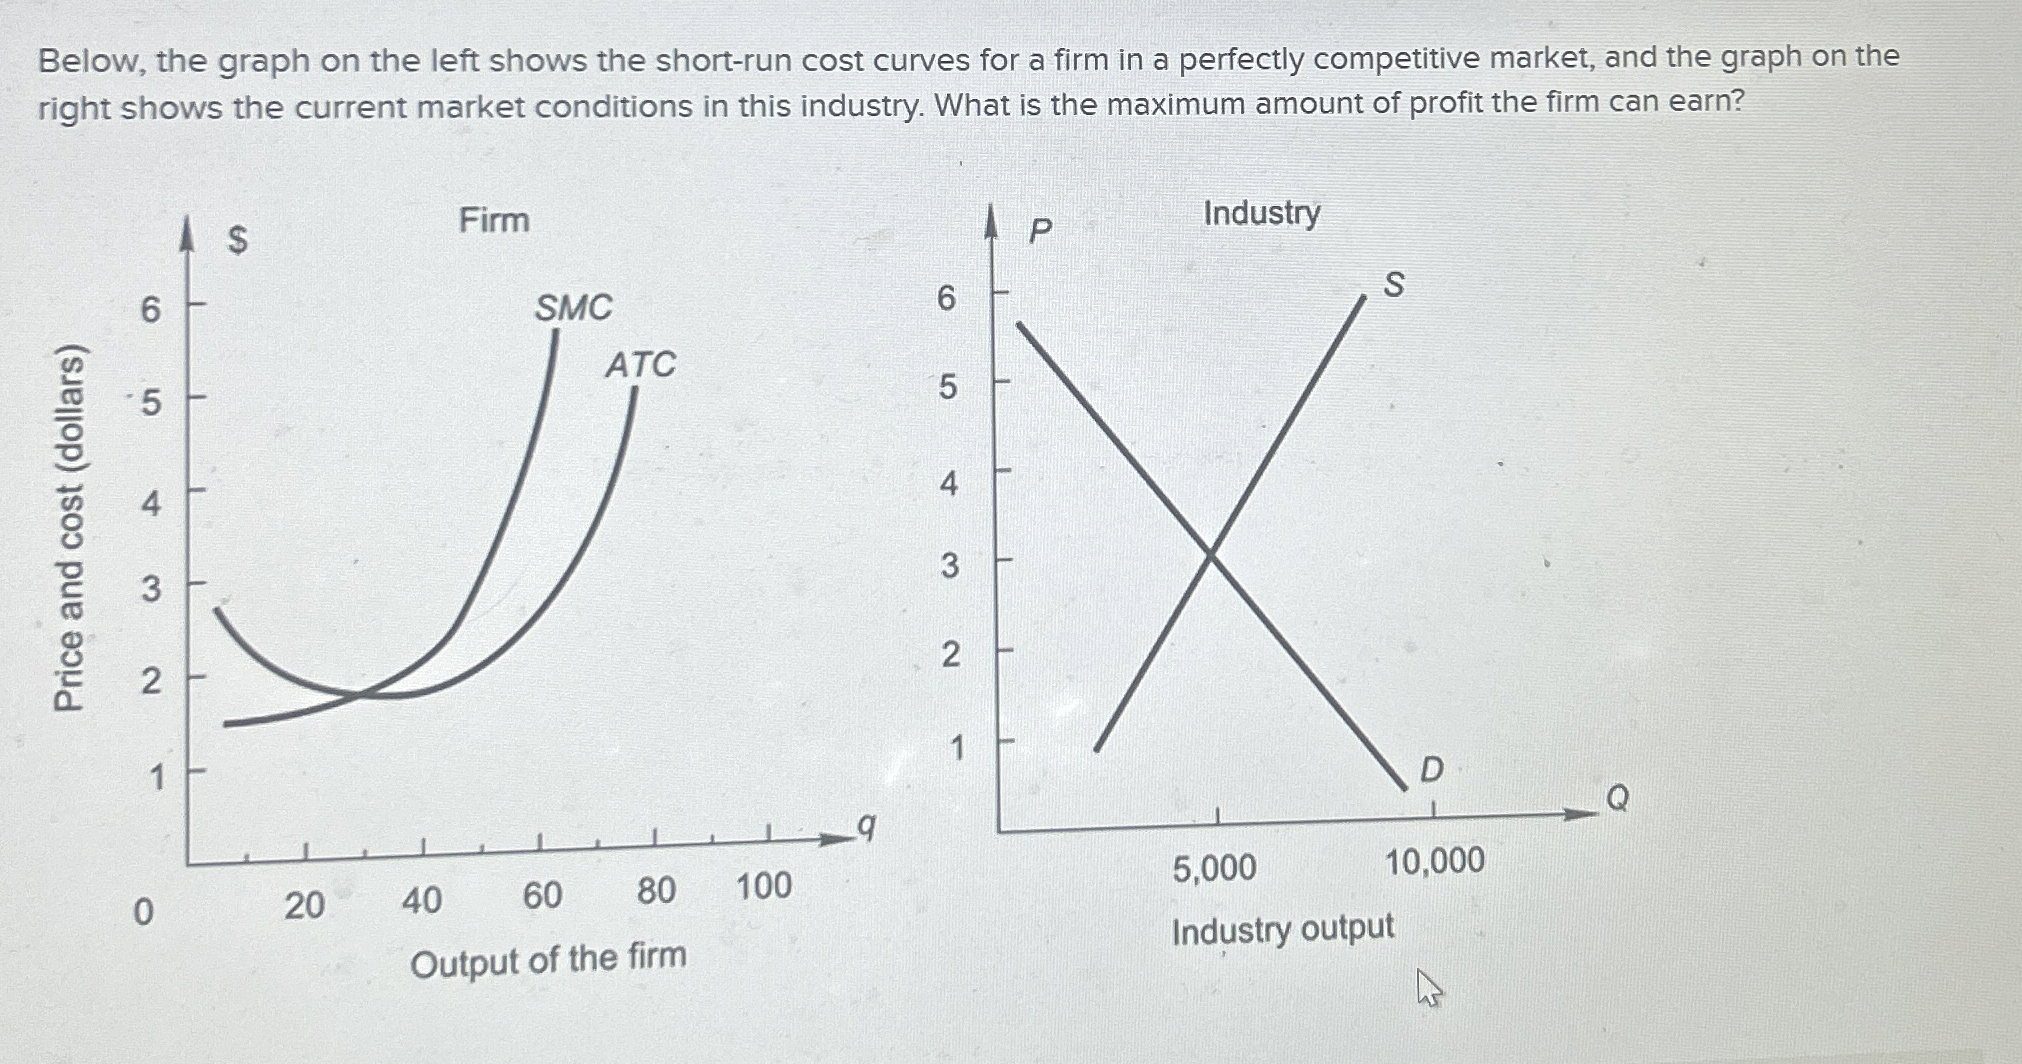
Question: Below, the graph on the left shows the short - run cost curves for a firm in a perfectly competitive market, and the graph on
Below, the graph on the left shows the shortrun cost curves for a firm in a perfectly competitive market, and the graph on the right shows the current market conditions in this industry. What is the maximum amount of profit the firm can earn?
Industry output
Step by Step Solution
There are 3 Steps involved in it
1 Expert Approved Answer
Step: 1 Unlock

Question Has Been Solved by an Expert!
Get step-by-step solutions from verified subject matter experts
Step: 2 Unlock
Step: 3 Unlock