

Question: 8. (6 points) Disney Geographical Financial Analysis ($ millions): Given the following Sales information, complete a growth analysis. Sales 2011 2012 2013 2014 2015 2016
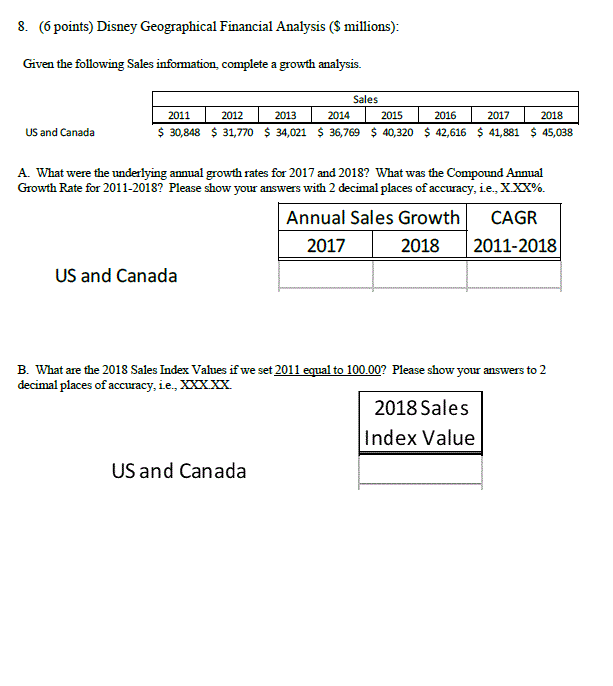
8. (6 points) Disney Geographical Financial Analysis ($ millions): Given the following Sales information, complete a growth analysis. Sales 2011 2012 2013 2014 2015 2016 2017 2018 $ 30,848 $ 31,770 $ 34,021 $ 36,769 $ 40,320 $ 42,616 $ 41,881 $ 45,038 US and Canada A. What were the underlying annual growth rates for 2017 and 2018? What was the Compound Annual Growth Rate for 2011-2018? Please show your answers with 2 decimal places of accuracy, i.e., X.XX%. Annual Sales Growth CAGR 2017 2018 2011-2018 US and Canada B. What are the 2018 Sales Index Values if we set 2011 equal to 100.00? Please show your answers to 2 decimal places of accuracy, ie., XXX.XX. 2018 Sales Index Value US and Canada
Step by Step Solution
There are 3 Steps involved in it

Get step-by-step solutions from verified subject matter experts