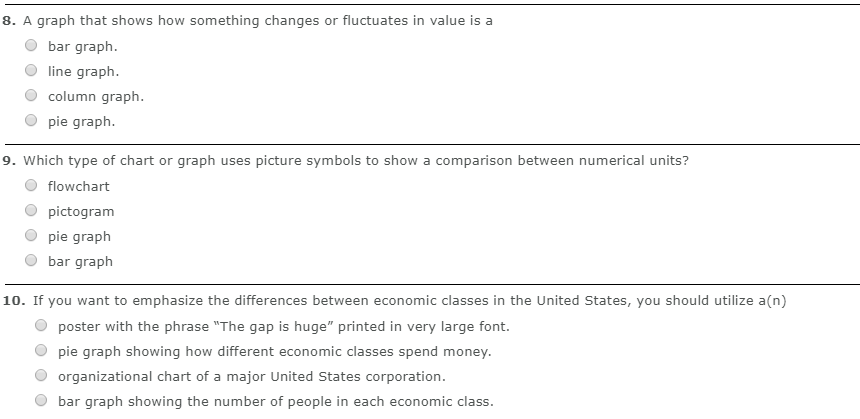
Question: 8. A graph that shows how something changes or fluctuates in value is a bar graph. line graph. column graph. pie graph. 9. Which type

8. A graph that shows how something changes or

8. A graph that shows how something changes or fluctuates in value is a bar graph. line graph. column graph. pie graph. 9. Which type of chart or graph uses picture symbols to show a comparison between numerical units? O flowchart pictogram pie graph bar graph 10. If you want to emphasize the differences between economic classes in the United States, you should utilize an) poster with the phrase "The gap is huge" printed in very large font. pie graph showing how different economic classes spend money. organizational chart of a major United States corporation. bar graph showing the number of people in each economic class

Step by Step Solution

There are 3 Steps involved in it

1 Expert Approved Answer
Step: 1 Unlock blur-text-image
Question Has Been Solved by an Expert!

Get step-by-step solutions from verified subject matter experts

Step: 2 Unlock
Step: 3 Unlock

Students Have Also Explored These Related General Management Questions!