

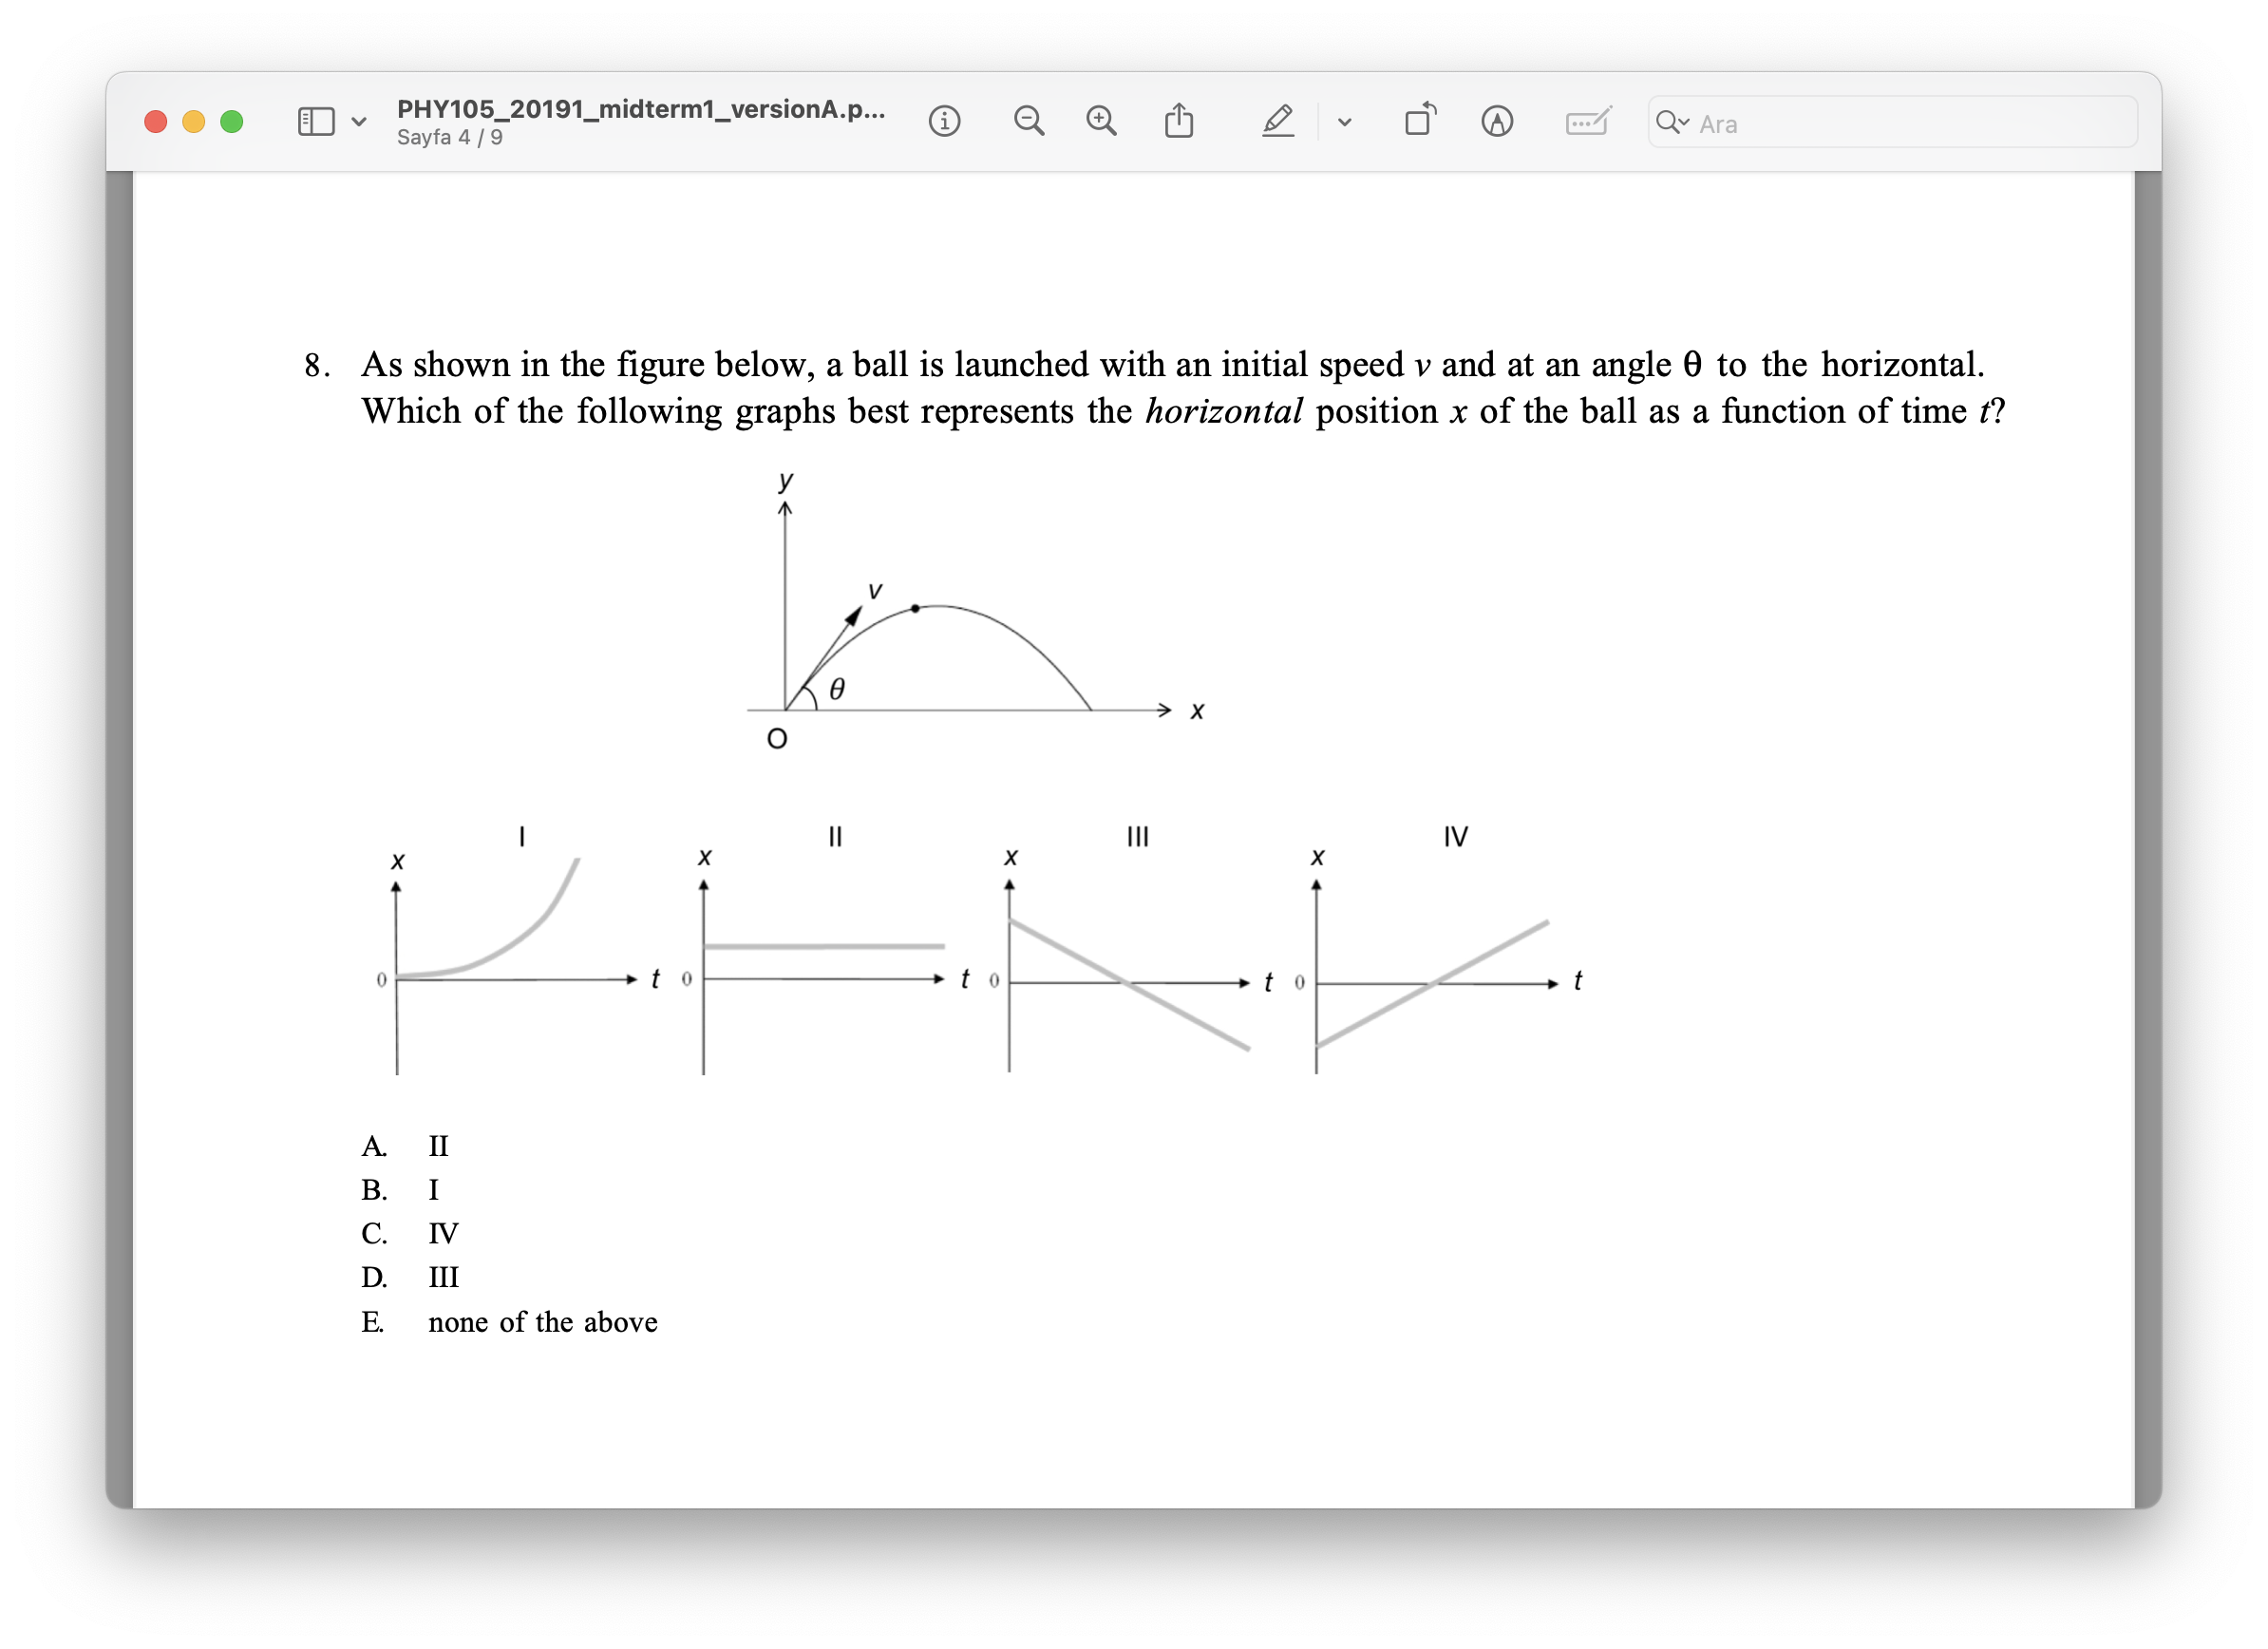
Question: 8 . As shown in the figure below, a ball is launched with an initial speed ( v ) and at an angle
As shown in the figure below, a ball is launched with an initial speed v and at an angle theta to the horizontal. Which of the following graphs best represents the horizontal position x of the ball as a function of time t
B I
C IV
D III
E none of the above
Step by Step Solution
There are 3 Steps involved in it
1 Expert Approved Answer
Step: 1 Unlock

Question Has Been Solved by an Expert!
Get step-by-step solutions from verified subject matter experts
Step: 2 Unlock
Step: 3 Unlock